


Despite ongoing struggles with budgets, aging facilities, staff shortages and the still-receding impact of the coronavirus pandemic, recreation and sports, aquatic and fitness facilities continue to report overwhelming stability, if not growth, with many planning construction and additions of amenities and programs at their facilities. That’s the overarching story of this, the 18th annual State of the Industry Report.
Since we first started reporting on major industry trends as revealed by our lengthy survey, back in 2007, the Industry Report has evolved to reflect major changes in the industry and, indeed, in the world at large. The impact of the Great Recession of the late aughts, as well as the coronavirus pandemic, was reflected in the numbers here, and the subsequent recoveries from those two major events have also been evident as facilities returned to stabler budgets and usage, as well as growth.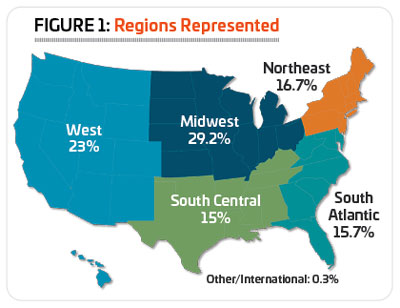
This year’s survey spotlights an industry that has found its footing in the post-COVID era. While a handful of respondents—10, to be exact—said that recovering from the impact of the pandemic was still their top challenge, that’s down significantly from just a year ago, when about 50 respondents felt the same. Participation has been on the rise, and while inflationary pressures have certainly made their impact known, the industry continues to see new facilities and programs develop.
In the following pages, we’ll break down the results of the Industry Report survey, comparing the responses of the entire survey population with those from specific groups, broken down by region, facility type and more. We’ll take operating budgets and revenues into account, cover staffing trends, look at building plans, and examine programming trends, wrapping up with an overview of industry’s biggest challenges.
In the sections that follow, we’ll offer coverage of the responses from unique cohorts, starting with an examination of the responses from those whose facilities include aquatics, starting on page 38. From there, we’ll take a look at some of the major facility types represented, including parks and recreation departments and districts (see page 56), colleges and universities (see page 68), schools and school districts (see page 74), health clubs and fitness facilities (see page 80), and finally, nonprofit facilities such as YMCAs, JCCs and Boys & Girls Clubs (see page 86). We’ll provide even more data at the RecManagement.com website with stories looking at the responses from camp-related facilities, as well as community and private recreation centers.
If you took the survey and are wondering where the salary information comes in, don’t fear. You’ll find that data reported next month in our Annual Salary Survey.
And of course, we’ll continue to provide a weekly dose of research in our Rec Report e-newsletter, so be sure to sign up for a subscription to get even more data delivered right to your inbox.
Who You Are
Demographically, there are a few things that set apart respondents to the Industry Report survey, including their level of 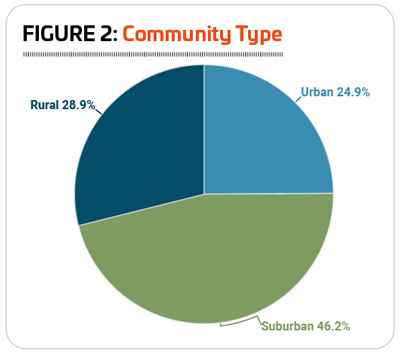 experience and decision-making responsibility. We’ll delve deeper into this information in the Salary Survey, appearing in the July 2024 issue, but let’s kick off this report with some details on the nearly 1,000 respondents who took the time to answer our 50-question survey.
Respondents to the Industry Report survey hold a variety of positions in their organizations, but the majority of respondents have high levels of responsibility in their organizations. The largest group of respondents—32.9%—said they are directors. Another 20.9% are in administrative and management positions, including administrators, managers and superintendents. Some 15.9% work in operations and facility management as operations managers, facility managers, building managers and supervisors. Another 11% said they are the chairman, CEO, president, vice president or owner of their organization or company. Some 10.6% are in program and activity administration roles, including activity and program directors, managers, coordinators, specialists, coaches and instructors. A very small number of respondents, just 1.2%, said they are faculty or teachers, and the remaining 7.4% hold other positions in their organizations.
On average, respondents have been working in the recreation, sports and fitness industry for 23.3 years, with an average span of 12.6 years in their current positions.
Nearly three in 10 (29.2%) respondents in 2024 were from the Midwest, including Illinois, Indiana, Iowa, Kansas, Michigan, Minnesota, Missouri, Nebraska, North Dakota, Ohio, South Dakota or Wisconsin. (See Figure 1.)
They were followed by the West, home to nearly one-quarter (23%) of the respondents. The West includes Alaska, Arizona, California, Colorado, Hawaii, Idaho, Montana, Nevada, New Mexico, Oregon, Utah, Washington and Wyoming.
Some 16.7% of respondents were from the Northeast, which includes the states of Connecticut, Maine, Massachusetts, New Hampshire, New Jersey, New York, Pennsylvania, Rhode Island and Vermont.
Another 15.7% of survey respondents call the South Atlantic region their home. This includes Delaware, Florida, Georgia, Maryland, North Carolina, South Carolina, Virginia, Washington, D.C., and West Virginia.
Finally, 15% of respondents said they were from the South Central region, which includes Alabama, Arkansas, Kentucky, Louisiana, Mississippi, Oklahoma, Tennessee and Texas.
Just two respondents (0.3%) were from outside the United States.
We also asked respondents what type of community they worked in, and the largest number—46.2%—said they worked in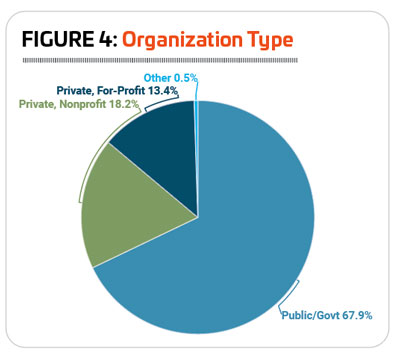 suburban communities. Another 28.9% worked in rural areas, and just under a quarter (24.9%) said they worked in urban communities. (See Figure 2.)
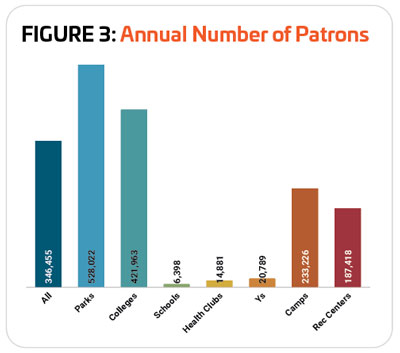
On average, respondents in 2024 said their facilities serve an average of 346,455 people per year. While this is up substantially from 2023, when respondents reached an average of 143,307 people, the wording of the question was changed in 2024 to provide greater clarity. Previously, we asked respondents about the size of the population they reached, whereas in 2024, we asked respondents to tell us how many people they serve per year.
Parks and colleges had the largest number of patrons. Park respondents reported an average of 528,022 patrons per year, while colleges saw an average of 421,963 patrons per year. They were followed by respondents from camps and rec centers, who see an average of 233,226 and 187,418 patrons on an annual basis. Respondents from Ys and health clubs had similar numbers of visitors in a year, at 20,789 and 14,881 respectively. And schools had the smallest annual reach, with an average of 6,398. (See Figure 3.)
More than two-thirds (67.9%) of respondents in 2024 said they were with public or governmental organizations—up from 57.6% in 2023. Another 18.2% of respondents were with private nonprofit organizations, such as YMCAs or Boys & Girls Clubs. Some 13.4% were with private, for-profit facilities, such as health clubs or resorts, and 0.5% said they were with “other” types of organizations. (See Figure 4.)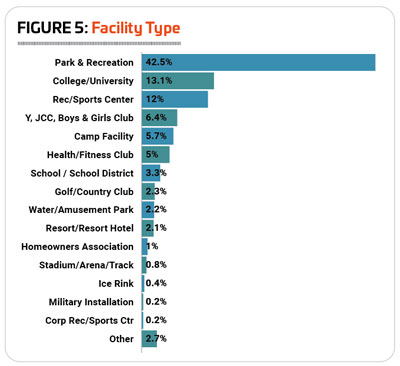
As usual, the largest group of respondents are from parks and recreation departments, park districts and similar organizations. In fact, in 2024, an even larger percentage of respondents than usual were from parks, a fact to bear in mind when considering the overall results of the survey. Some 42.5% of respondents said they were from parks, up from 31.5% in 2023, and 31.6% in 2022, though a similar number (42.7%) reported from parks in 2021. They were followed by respondents from colleges and universities (13.1%), community or private recreation and sports centers (12%), YMCAs, YWCAs, JCCs, Boys & Girls Clubs and similar facilities (6.4%), private or youth camps, and campgrounds and RV parks (5.7%), health, fitness and medical fitness facilities (5%), and schools and school districts (3.3%). (See Figure 5.)
Other types of facilities were represented by fewer respondents, including: golf and country clubs (2.3%); waterparks and amusement parks (2.2%); resorts and resort hotels (2.1%); homeowners associations (1%); stadiums, arenas and tracks (0.8%); ice rinks (0.4%); military installations (0.2%); and corporate recreation and sports centers (0.2%). Another 2.7% of respondents were with “other” types of facilities, including a bowling center, a conservation center and a special recreation association. In 2024, no respondents reported from churches (0.7% of respondents in 2023) or racquet and tennis clubs (0.3% in 2023). 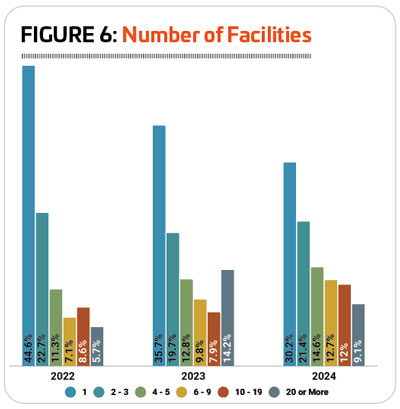
The vast majority of parks respondents—98.5%—were with public or governmental organizations, with 1% representing private, nonprofits and another 0.5% representing some other type of organization. Rec center, school and college respondents were all also most likely to be from public organizations. Some 79.5% of rec center respondents were with public organizations, while 11.1% were with private nonprofits and 9.4% were with private for-profit organizations. More than seven in 10 (71.9%) school respondents were with public schools, while 15.6% were with private nonprofit schools, 9.4% were with private for-profit schools and 3.1% were with other types of organizations. And 69% of college respondents were with public universities, while 23% were with private nonprofit colleges, 7.1% were with private for-profit schools and 0.8% were with other types of organizations.
Health club respondents were the only cohort most likely to work for private for-profit organizations, with more than two-thirds (67.3%) of these respondents indicating they were for-profit facilities. Another 20.4% were with private nonprofit facilities, and 12.2% were public or governmental organizations.
Y respondents were the most likely to be with private nonprofits, as makes sense, with 88.7% of Y respondents indicating they worked for a nonprofit. Another 8.1% were with public/governmental organizations, and 3.2% were with private for-profit organizations. Camp respondents presented a mixed picture, with 52.7% representing private nonprofits, and the remainder divided between private for-profit (23.6%) and public/governmental (23.6%) organizations. 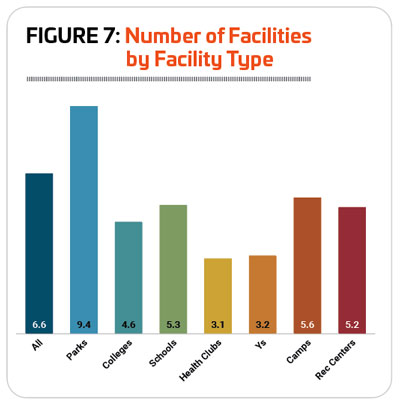
On average, respondents manage 6.6 separate facilities, falling in between the numbers from 2023 (8.5) and 2022 (5.6). Fewer respondents in 2024 said they manage just a single facility. Some 30.2% of respondents in 2024 said they manage just a single facility, compared with 35.7% in 2023 and 44.6% in 2022. Another 21.4% of respondents in 2024 manage between two and three facilities, up from 19.7% in 2023. At the same time, more respondents in 2024 managed between 10 and 19 facilities (12%, up from 7.9%), while fewer managed 20 or more in 2024 (9.1% vs. 14.2% in 2023). (See Figure 6.)
Respondents from parks had the greatest number of facilities to manage, with an average of 9.4, down from 13.3 in 2023, but in line with 2022, when park respondents averaged nine facilities. They were followed by respondents from camps (5.6), schools (5.3) and rec centers (5.2). Respondents from health clubs (3.1) and Ys (3.2) had the smallest number of facilities to manage. (See Figure 7.)
Partnering with other organizations is a savvy way for recreation, sports and fitness facilities to expand their funding, programming and other capabilities. Whether it’s partnering with a nonprofit on fundraising, a friends group on site cleanup and maintenance or a local school district on outreach, there are myriad ways to work with others. In 2024, the majority (85.4%) of respondents said they currently partner with other organizations, up from 84.4% in 2023 and 82.3% in 2022 (though still below numbers from earlier years—89% of respondents in 2020 had formed partnerships).
As always, local schools were the most common type of partner for all types of facilities. Nearly six out of 10 (59.9%) 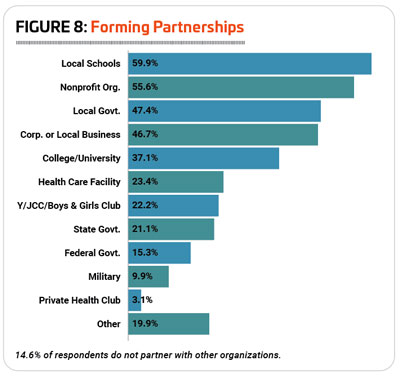 respondents said they had partnered with local schools, up from 57.1% in 2023. The next most common types of partners included nonprofit organizations (55.6% had partnered with them, up from 50.9%); local governments (47.4%, up from 39.7%); corporations or local businesses (46.7%, up from 41.4%); and colleges and universities (37.1%, up from 35.6%). (See Figure 8.)
Respondents from Ys, parks and rec centers were the most likely to report that they had partnered with other organizations. Some 96.1% of Y respondents, 92.9% of park respondents and 85.6% of rec center respondents said they had formed partnerships with other organizations. And while health clubs were the least likely to have partnered (no surprise, given their for-profit nature), more than half (52.6%) had done so. Falling in the middle were respondents from schools (84%), colleges (82.6%) and camps (80.4%). (See Figure 9.)
Respondents from Ys were the most likely to partner with local schools (86.3%), corporate or local businesses (66.7%), other Ys (64.7%), health care and medical facilities (41.2%), state government (31.4%) and the military (19.6%). Parks respondents were the most likely to partner with nonprofit organizations (69.4%) and local government (65.7%). Colleges and universities were the most likely to partner with other colleges and universities (67.4%). Camps were the most likely to partner with the federal government (26.1%). And health clubs were the most likely to partner with other health clubs (7.9%). 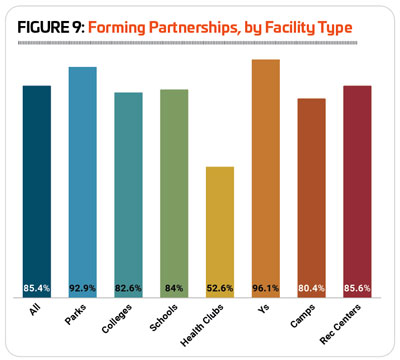
When it comes to the typical age range of their audience, respondents were most likely to report that they serve all ages. Nearly half (48.2%) of respondents said their facilities are primarily meant for all ages, up from 43.2% in 2023, and 36.1% in 2022. This group was followed distantly by respondents serving a specific age range, with adults ages 19 to 64 being the next most common audience (16.9% of respondents primarily reach adults, down from 18.3%), followed by children ages 4 to 12 (14.9%, down from 17%). Smaller numbers of respondents said that the primary audience for their facilities was made up of colleges students (10.1%, up from 8.8%), teens ages 13 to 18 (5.4%, down from 8.4%), seniors 65 and older (3.7%, representing virtually no change from 3.8%), and infants and toddlers (0.8%, vs. 0.4%). (See Figure 10.)
Respondents from parks and Ys were the most likely to report that their primary audience was made up of all ages. Some 60.1% of park respondents and 58.8% of Y respondents said they served all ages at their facilities. The respondents most likely to reach an audience of adults between 19 and 64 were from health clubs, where 56.1% said they primarily serve adults. Children 4 to 12 were the most likely audience for respondents from camps (26.1%). College students were obviously the most likely audience for respondents from colleges and universities (81.1%). Teens were most likely to be the primary audience for respondents from schools and school districts (50%). Seniors were most likely to be the primary audience for health club respondents (9.8%). Finally, infants and toddlers were most likely to be the primary audience for schools and school districts (11.5%). 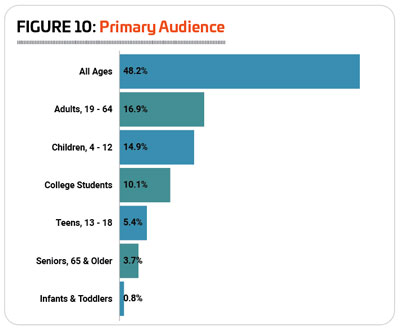
Revenues & Expenditures
In 2023, the overall revenue picture for respondents continued to improve, and in fact, reflected some of the most positive results seen in the Industry Report, even before the coronavirus pandemic. In the four years leading up to the pandemic (2016 to 2019), while around 11% of respondents each year reported a decrease in revenues, the overall picture was one of stability and growth, with between around 42% to 48% of respondents reporting stable revenues and between 41% and 48% reporting growth. Of course, in 2020, facilities were forced to either shut down or drastically change their operations to ensure safety of patrons during the onset of the coronavirus pandemic, and nearly two-thirds (64.9%) saw a decrease in revenues.
In 2021 and 2022, while around half of respondents (51.7% and 49.7%, respectively) reported increasing revenues, more than double the typical number reported that their revenues had fallen, with 26.7% reporting a drop in 2021 and 21% reporting a drop in 2022.
The year 2023 shows a return to the more typical numbers of respondents reporting decreasing revenues, with 11.4% indicating their revenues had fallen. At the same time, though, well over half (54.4%) of respondents said their revenues increased in 2023, and 34.2% reported their revenues had remained stable. (See Figure 11.)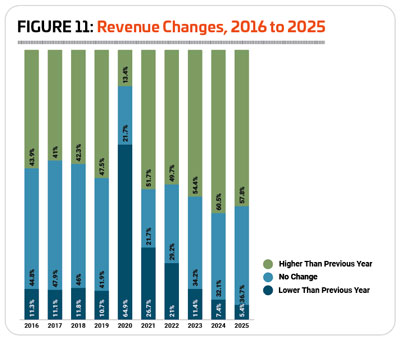
Looking at 2024, respondents were optimistic that revenues would continue to increase, with 60.5% indicating they expected their revenues to grow. Another 32.1% said they expected revenues to remain the same in 2024, and 7.4% were anticipating a decrease.
Looking forward to 2025, respondents are similarly positive about growth, with 57.8% expecting revenues to increase, 36.7% expecting no change, and 5.4% anticipating a decline in revenues.
The average operating expenditure reported for fiscal 2023 was 33.5% higher than the average reported in 2022. In 2022, respondents reported an average operating expense of $2,798,000, a number which rose to $3,734,000 in 2023. The highest reported operating expense in 2023 was $107 million (compared with a high of nearly $132 million in 2022), and the median expense was $900,000 (vs. $700,000 in 2022). (See Figure 12.)
In 2024, respondents are expecting their average operating cost to decrease by 4.1%, to $3,582,000. The highest projected cost for 2024 is $110 million, and the median expense holds steady at $900,000.
Looking forward to 2025, respondents are expecting an increase of 2.4% over the average for 2023, with a mean of 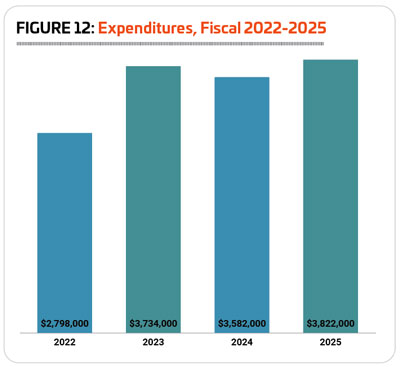 $3,822,000. The highest anticipated cost in 2025 is again $110 million, with the median increasing 1.1% to $910,000.
Considered by community type, respondents from suburban communities reported both the highest average operating cost for 2023, as well as the highest overall increase to operating costs from 2022. Suburban respondents reported an average operating cost of $4,769,000 for 2023, 52.8% higher than the average for 2022 of $3,123,000. Urban respondents had the next highest operating cost for 2023, at $4,459,000, a 3.3% increase from the 2022 average of $4,317,000. Finally, rural respondents reported a 9.8% increase to average operating expenses in 2023, from $1,767,000 in 2022 to $1,941,000.
Looking forward, respondents from urban and suburban communities projected a decrease in their average operating expenditures from 2023 to 2025, while rural respondents were anticipating a hefty increase in spending. Urban respondents reported an expected expenditure for 2025 of $3,701,000, a decrease of 17% from 2023. Suburban respondents reported a slightly smaller decrease of 5.9%, to an average of $4,487,000. At the same time, rural respondents anticipated their average operating expenditure to increase by 58.5%, to $3,077,000.
The wide range in high and low operating costs can drive some interesting changes from year to year. In 2023, 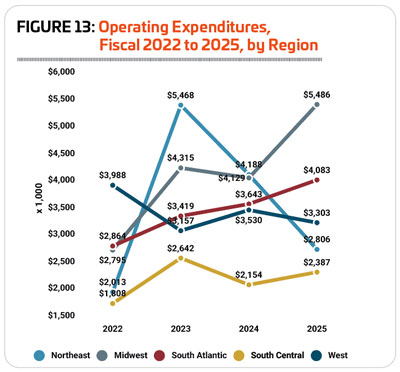 respondents in the Northeast reported both the highest average operating expense, as well as the greatest increase to operating expense from 2022. In 2023, Northeastern respondents averaged $5,468,000 in operating expenses, up 171.6% from 2022, when their average cost was $2,013,000. That said, when the median expense is considered instead of the mean, the increase for Northeastern respondents was a more modest 25%, from $420,000 to $525,000. (See Figure 13.)
Midwestern respondents had the second highest operating cost in 2023, at $4,315,000, a 54.4% increase from 2022’s average of $2,795,000. (The median costs for Midwestern respondents in 2022 and 2023 were $675,000 and $1,023,000, respectively.) They were followed by respondents in the South Atlantic, with an average operating cost in 2023 of $3,419,000, 19.4% higher than the average for 2022 of $2,864,000. (Median costs in the South Atlantic were $695,000 in 2022 and $1 million in 2023.)
The West was the only region to see a decrease in operating costs from 2022 to 2023, with respondents there reporting an average cost of $3,157,000 in 2023, 20.8% less than the average cost in 2022, $3,988,000. (The median cost for Western respondents was $1 million in 2022 and in 2023.)
And as is generally the case, respondents in the South Central region had the lowest overall operating cost in 2023, at $2,642,000, 46.1% higher than their average for 2022 of $1,808,000. (South Central respondents had a median cost of $800,000 in 2022 and $638,000 in 2023).
Looking forward, respondents from the Midwest were expecting the greatest increase to their average operating cost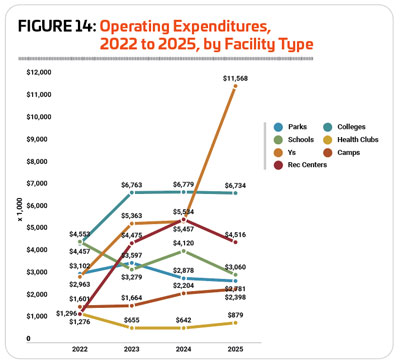 from 2023 to 2025, with an increase of 27.1%, to an average of $5,486,000. They were followed by the South Atlantic region, where respondents projected a 19.4% increase from 2023 to an average of $4,083,000 in 2025. Respondents in the West were also expecting an increase, though at a slower rate of 4.6%, to an average of $3,303,000 in 2025.
The average operating cost for Northeastern respondents was projected to drop 48.7% between 2023 and 2025, falling to $2,806,000. (When considering the median, the decrease is a more modest 20.4%, from $525,000 in 2023 to $418,000 in 2025.) Respondents in the South Central region also projected a decrease, with average operating costs falling 9.7% to $2,387,000.
When it comes to facility type, respondents from colleges, Ys and rec centers reported the highest overall operating costs in 2023, with rec center respondents reporting the greatest overall increase in costs from 2022 to 2023. College respondents had the highest average operating cost in 2023, at $6,763,000, 51.7% higher than the average cost in 2022 of $4,457,000. They were followed by Ys, with an average cost in 2023 of $5,363,000, 81% higher than the average cost in 2022 of $2,963,000. And rec centers reported a steep 250.7% increase to their average operating cost, from $1,276,000 in 2022 to $4,475,000 in 2023. (See Figure 14.)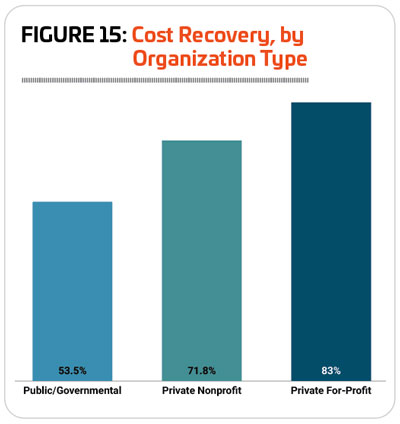
More modest increases were seen by respondents from parks, who saw their average operating expenses climb 16% from $3,102,000 in 2022 to $3,597,000 in 2023, as well as camp respondents, who reported a 3.9% increase from an average of $1,601,000 in 2022 to $1,664,000 in 2023.
Respondents from health clubs and schools reported a decrease to their average operating expenses from 2022 to 2023. Health clubs saw their average expense fall by 49.5%, from $1,296,000 in 2022 to $655,000 in 2023. And school respondents reported a decrease of 27.9%, from $4,553,000 in 2022 to $3,279,000 in 2023.
Looking forward, the greatest increases in average operating costs are expected by Ys, who projected a 115.7% increase from 2023 to an average of $11,568,000 in 2025. They were followed by camps, where respondents projected a 44.1% increase to an average of $2,398,000 in 2025, and health clubs, with a 34.2% increase to an average of $879,000 in 2025. Rec center respondents also reported a slight 0.9% increase, to an average of $4,516,000 in 2025.
Other respondents projected decreases to their average operating cost, with the greatest decrease seen by respondents from parks, who projected a 22.7% decline to an average of $2,781,000 in 2025. School respondents also projected a decrease, with average operating costs falling 6.7% to $3,060,000 in 2025. Respondents from colleges reported virtually no change, with a 0.4% decrease to $6,734,000 in 2025.
On average, respondents recover 61.5% of their operating costs via revenues. Private for-profit organizations had the highest rate of cost recovery, at 83%. They were followed by private nonprofits, which recover an average of 71.8% of their operating costs via revenues. And while public/governmental organizations earned back the lowest percentage of their operating costs, they still recovered more than half—53.5%—via revenues. (See Figure 15.)
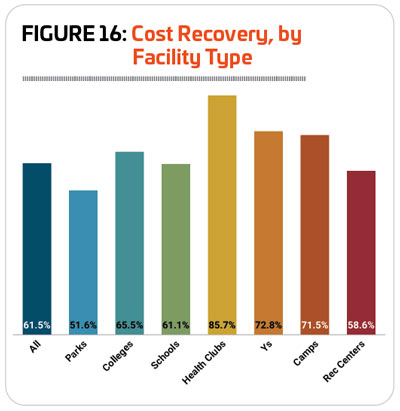
When considered by facility type, the cost recovery numbers fall along similar lines, with those most likely to be for-profit (i.e., health clubs) earning the highest share, and governmental organizations (i.e., park districts) earning the lowest. Respondents from health clubs averaged 85.7% cost recovery. They were followed by Ys (72.8%) and camps (71.5%). Park respondents recovered the lowest percentage of their costs via revenues, at 51.6%. (See Figure 16.)
The number of respondents who reported that they have taken action of some kind to lower their operating costs has held steady over the past few years. In 2024, 83.2% of respondents indicated that they had taken action to reduce their expenditures, compared with 83.3% in 2023 and 83.8% in 2022. The most common methods respondents turned to in order to reduce their costs were much the same as in 2023. Most common was an increase in fees. Some 50.7% of respondents in 2024 said they had increased their fees, compared with 51.5% in 2023. More than one-quarter of respondents said they had: improved energy efficiency (38.7%, compared with 35.5% in 2023); put construction or renovation plans on hold (34.2%, vs. 34.4% in 2023); reduced their hours of operation (27.8%, vs. 31.1%); or reduced staff (27.8%, vs. 30%). (See Figure 17.) 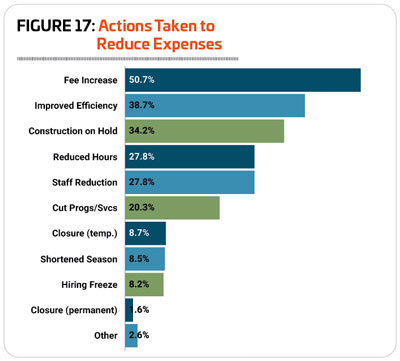
In 2024, respondents from schools and school districts were the most likely to report that they had taken action to reduce their expenditures, followed by camps and Ys. Some 90.5% of school respondents said they had taken such actions, while 88.6% of camp respondents and 88.1% of Y respondents had done so. They were followed by colleges and universities (86.8%), rec centers (84.9%) and parks (81.3%). Health club respondents were far less likely than others to indicate that they had taken action to reduce their costs, though well over two-thirds (69.7%) had done so.
Respondents from schools were the most likely to report that they had improved energy efficiency at their facilities (57.1%). They were tied with camps for being most likely to put construction on hold (42.9%), and were tied with Ys for being most likely to have permanently closed a facility (4.8%).
Respondents from camps were the most likely to report that they had increased their fees (62.9%).
College respondents were the most likely to indicate that they had reduced their hours of operation (58.8%), reduced staff (39.7%), cut programs or services (36.8%), temporarily closed a facility (13.2%) or shortened their season of operation (11.8%).
Finally, rec center respondents were the most likely to report that they had instituted a hiring freeze (12.3%). 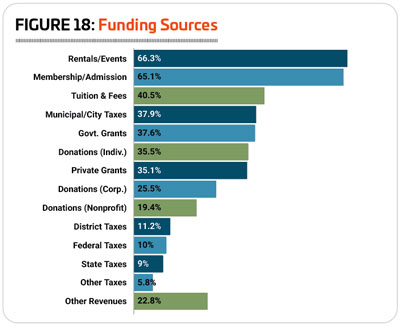
When it comes to the sources of funding for their facilities, the most common were revenues from rentals and private events (66.3%), membership and admission fees (65.1%) and tuition and fees (41.5%). More than a quarter of respondents also said they received revenues via municipal or city taxes (37.9%), government grants (37.6%), individual donations (35.5%), private grants (35.1%), and corporate donations (25.5%). Just 3.1% of respondents were unsure about the sources of funding for their facilities. (See Figure 18.)
Membership & Usage
As in most years of the survey, approximately six out of 10 respondents said that they charge a fee for membership or for usage of their facilities. Some 63.4% of 2024’s respondents said they currently charge a fee, up slightly from 60.5% in 2023 and 60.7% in 2022.
Respondents from Ys and health clubs were the most likely to report that they currently charge a fee for membership or usage, with 96% of Y respondents and 87.8% of health club respondents indicating that they do so. More than six out of 10 respondents from rec centers (66.3%) and colleges (60.7%) also said they charge a fee. Respondents from camps (58.5%), parks (57.8%) and schools (44%) were less likely to charge a fee for membership or usage of their facilities.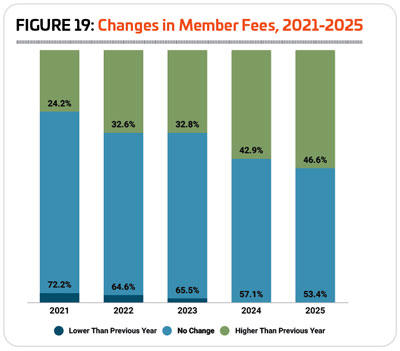
In 2023, respondents were most likely to leave their fees unchanged, with nearly two-thirds (65.5%) of respondents indicating they made no change to their fees. Another 32.8% of respondents raised their fees in 2023, and 1.7% lowered their fees. Looking forward, 42.9% of respondents said they expect to increase their fees in 2024, and 46.6% are anticipating an increase in 2025, while no respondents have plans to lower fees in the next two years. (See Figure 19.)
Respondents from camps and health clubs were the most likely to indicate that they had increased their membership or usage fees in 2023. Half (50%) of camp respondents said they raised their fees in 2023, down slightly from 54.1% in 2022. They were followed by health clubs, where 48.6% of respondents had increased fees, up from 33.3% in 2022. Colleges were the least likely to report a fee increase for 2023, with just over a quarter (27.8%) of college respondents indicating they had increased fees.
Looking forward, camp respondents were also the most likely to be planning a fee increase in 2024. Two-thirds (66.7%) of camps said they planned to increase their fees in 2024. They were followed by Ys (63.8%) and rec centers (50%). Schools were the least likely to be planning a fee increase, though 36.4% of school respondents did report that they planned to increase fees in 2024.
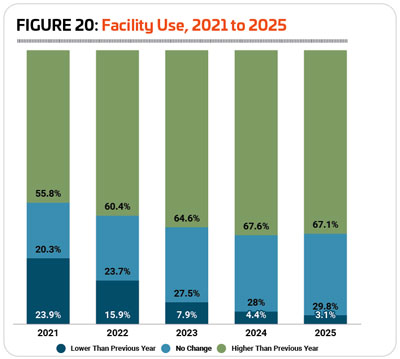
Over the past several years, facilities have gradually recovered from the impact of the pandemic on the number of people using their facilities, and in 2023, nearly two-thirds (64.6%) said the number of people using their facilities increased, while 27.5% said there was no change, and 7.9% said the number of people using their facilities declined. (See Figure 20.)
Looking ahead to 2024 and 2025, around two-thirds of respondents are expecting the number of people using their facilities to increase, with 67.6% anticipating an increase in 2024 and 67.1% expecting an increase in 2025. Just 4.4% expect usage of their facilities to decline in 2024, and 3.1% are expecting a decrease in 2025.
Respondents from Ys were the most likely to report an increase in the number of people using their facilities in 2023. Some 81.6% of Y respondents said they saw an increase in usage in this time frame. They were followed by rec centers (78.5%) and health clubs (71.8%). College respondents were the least likely to report an increase in the number of people using their facilities in 2023, though 42.5% indicated there was an increase in this year.
Looking forward, Ys, rec centers and parks were the most likely to expect further increases in the number of people using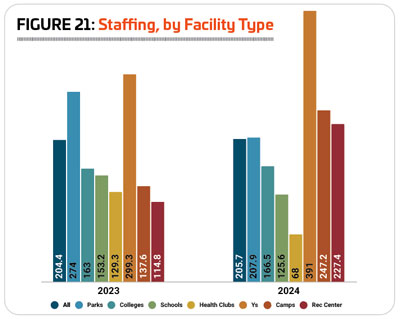 their facilities in 2024 and 2025. A majority of respondents from Ys expected an increase in 2024 (81.3%) and 2025 (80%). They were followed by rec centers (78.3% expect an increase in 2024, 77% in 2025), and parks (74% and 69.8%, respectively). College respondents were again the least likely to be anticipating increasing usage over the coming years, with 43.2% expecting an increase in 2024 and 51.3% expecting an increase in 2025.
Staffing
On average, respondents to the Industry Report survey employ 205.7 workers, representing virtually no change from 204.4 in 2023. This includes an average of 41.8 full-time employees (up from 36), 53.9 part-time employees (up from 52.8), 49.5 seasonal employees (up from 47.7), and 60.5 volunteers (down from 67.9).
As always, Ys employed the largest number of people, with an average of 391 employees of all kinds, up from 299.3 in 2022. This includes 21.4 full-time employees, 130.4 part-time employees, 48.9 seasonal employees and 190.3 volunteers. They were followed by camps with an average of 247.2 employees (16 full-time, 12.9 part-time, 51.6 seasonal and 166.7 volunteers), and rec centers with an average of 227.4 employees (37.6 full-time, 70.8 part-time, 52.5 seasonal and 66.5 volunteers). (See Figure 21.)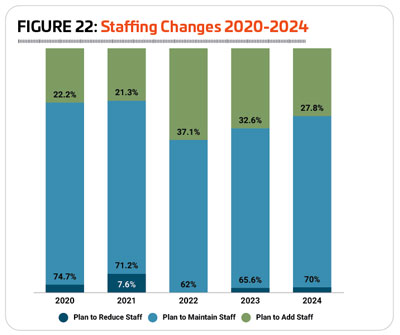
Seven out of 10 respondents in 2024 (70%) said that they plan to maintain their existing staffing levels this year. Another 27.8% were planning to add staff, and just 2.2% were planning to reduce staff. This brings hiring down slightly from the past few years, as in 2023 32.6% of respondents were planning to add staff, and in 2022, 37.1% of respondents had plans to add staff. (See Figure 22.)
Certifications are a common tool in many fields to help verify ongoing knowledge retention and to ensure professionals remain up-to-date on the latest information and best practices in their field. Aquatic, recreation, sports and fitness facilities are no exception, and careers in this industry are covered by a broad array of credentials, from the very specific, like the Certified Park & Recreation Professional (CPRP), offered through the National Recreation and Park Association (NRPA), lifeguard certification or pesticide application certification, to broader certifications like CPR/AED/First Aid and foodservice certifications.
In 2024, 78.7% of respondents said they currently require certification of some kind for at least some of their staff. This is up slightly from 2023 (76.9%), but more in line with 2022, when 78.7% of respondents required certifications. 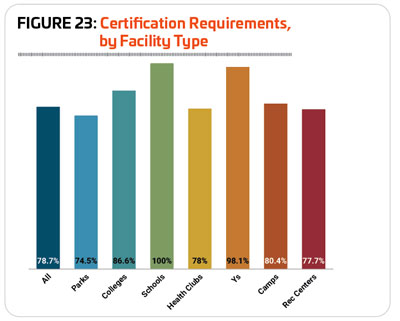
Respondents from schools and Ys were the most likely to require certifications for some of their staff members. A full 100% of school respondents said they currently require certifications, up from 84.4% in 2023, and 98.1% of Y respondents require certifications, up from 93.8%. They were followed by colleges (86.6% require certifications, down from 89.1%), camps (80.4%, up from 76.2%), health clubs (78%, down from 80.5%), and rec centers (77.7%, unchanged from 2023). Park respondents were the least likely to require certification for their staff members, though nearly three-quarters (74.5%) do have this requirement, down slightly from 75.1% in 2023. (See Figure 23.)
As always, the most commonly required certification is CPR/AED/First Aid training. The majority (89.4%) of respondents who require any certifications require this one, up from 85.3% in 2023. More than half of respondents who require any certifications said they ask for background checks (69.3%) or lifeguard certifications (60.9%). More than a quarter require aquatic management or pool operations certifications (40.5%), personal training and fitness certifications (30.5%), or foodservice certification (26.3%). (See Figure 24.) 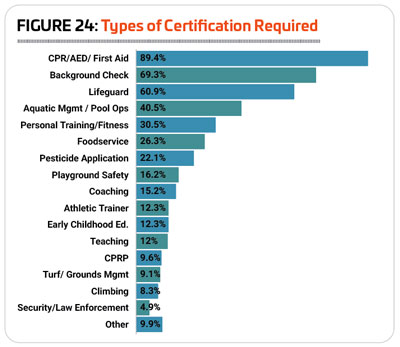
Obviously, respondents whose facilities include swimming pools or other aquatic features require lifeguard and aquatic management certifications for their staff at a much higher rate. While 60.9% of all respondents require lifeguard certifications, 82.4% of those with aquatics require them. And while 40.5% of all respondents require aquatic management or pool operations certifications, for aquatic respondents that number jumps to 56.7%.
Similarly, different types of facilities are more likely to require certain types of certifications, in line with their operations. Thus, parks, with their extensive grounds and playgrounds, are more likely than others to require pesticide application certification (35.8%), playground safety certifications (32.1%), and turf and grounds management certification (14.6%), as well as the CPRP certification (17.1%). Respondents from colleges were more likely than others to require athletic trainer (27.7%) and climbing (24.1%) certifications. School respondents were the most likely to require coaching (45.8%), teaching (37.5%) and security or law enforcement certification (20.8%). Health club respondents were the most likely to require personal training or fitness certifications (77.4%). Respondents from Ys were the most likely to require CPR/AED/First Aid training (98.1%), background checks (80.8%), lifeguard certification (76.9%), aquatic management certification (51.9%), and early childhood education certification (42.3%). Finally, camp respondents were the most likely to require foodservice certifications (48.4%).
Facilities & Construction Plans
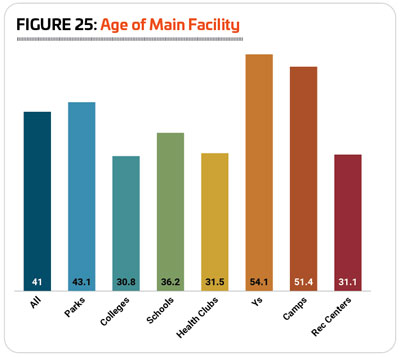
For the first time since we started asking respondents about the age of their flagship facility, the average for 2024 was lower than for 2023. In 2023, respondents’ flagship facilities were an average of 43.7 years old, and in 2024, that average fell to 41.
In another change, respondents from Ys had the oldest facilities (usually, camp respondents hold this distinction). Y respondents’ flagship facilities were an average of 54.1 years old (up from 45.5), followed by camps, at 51.4 years old (down from 61.5). They were followed by parks, with an average of 43.1 years (down from 44.4), and schools, at 36.2 years (down from 49.1). Respondents from colleges and health clubs had the newest facilities, relatively, though their flagship facilities averaged 30.8 years and 31.5 years, respectively. (See Figure 25.)
More than two-thirds (68.3%) of respondents in 2024 said they have plans for new construction, additions or renovations at their facilities over the next few years. This is up from 65.1% in 2023, but still below the 70.5% reported in 2022.
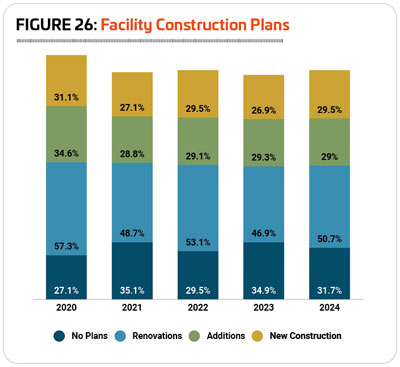
In 2024, some 50.7% of respondents said they had plans for renovations at their existing facilities, up from 46.9% in 2023. Another 29% had plans for additions, representing virtually no change from 29.3% in 2023. And 29.5% of respondents said they had plans to build new facilities, up from 26.9% in 2023. (See Figure 26.)
Respondents from camps were once again the most likely to have plans for construction, with 85.4% of camp respondents indicating they had plans to build new, make additions or renovate their existing facilities. This is up from 74.5% in 2023, but below the 92.1% reported in 2022. They were followed by respondents from Ys, where 78.7% had plans for construction, up from 67.1% in 2023, and parks, where 74.6% of respondents had plans for construction, representing virtually no change from 2023, when 74.3% had construction plans. Slightly fewer respondents from rec centers (60.2%, up from 58.1%) and colleges (60%, virtually unchanged from 60.4%) had plans for construction in 2024. Respondents from schools (45.8%, down from 53.5% in 2023) and health clubs (33.3%, down from 42.3% in 2023) said they had plans for construction at their facilities over the next few years.
Park respondents were the most likely to be planning new construction, with 36.9% of park respondents indicating they would be building new facilities. They were followed by respondents from rec centers (29.5%) and camps (29.3%).
Respondents from camps were the most likely to be planning additions at their existing facilities. Some 46.3% of camp respondents said they had such plans. They were followed by Ys (36.2%) and parks (31.5%).
Camp respondents were also the most likely to be planning renovations to their existing facilities. Nearly two-thirds (63.4%) of camp respondents said they were planning renovations. They were followed by respondents from parks (55.3%) and Ys (55.3%).
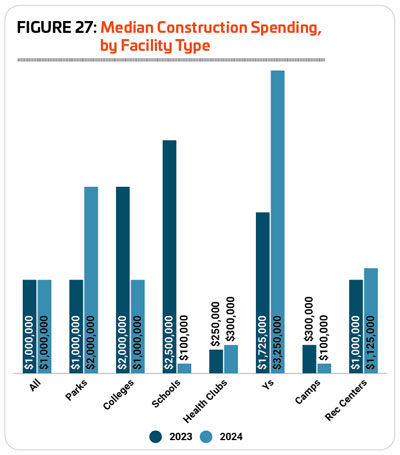
As in 2023, the median amount planned for construction in 2024 is $1 million. The highest spenders this year are Ys, with a median construction cost of $3,250,000. They were followed by parks ($2 million), rec centers ($1,125,000) and colleges ($1 million). Respondents from schools and camps had the lowest median construction cost, at just $100,000. (See Figure 27.)
Considered by region, respondents in the West again were planning to spend the greatest amount. The region’s median construction spending planned in 2024 was $2 million, up from $1.7 million in 2023. They were followed by the Midwest, with a median construction budget in 2024 of $1,750,000, up from $850,000 in 2023. Respondents from the Northeast and South Central regions both had a median construction cost of $1 million, representing no change for the Northeastern respondents, and up from a median of $850,000 in the South Central region. Finally, respondents in the South Atlantic states had a median construction cost in 2024 of $950,000, up from $500,000 in 2023. 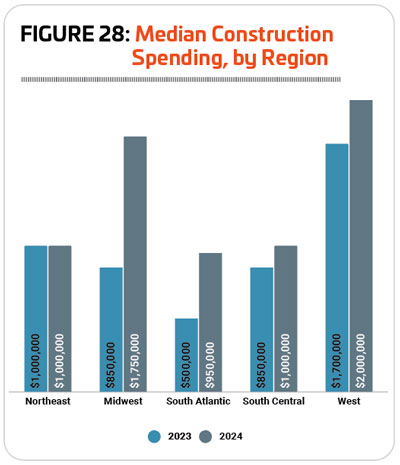 (See Figure 28.)
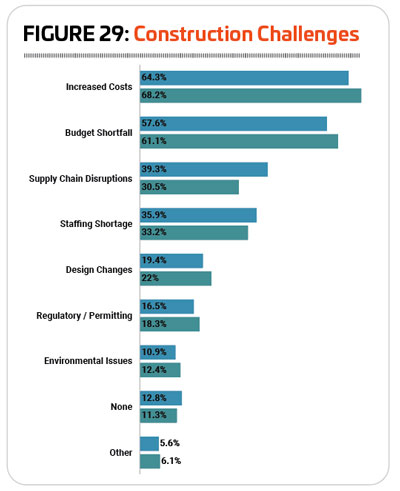
Asked about the challenges and setbacks they have faced getting construction and renovations under way, only 11.3% of respondents said they had experienced none, down from 12.8% in 2023. The biggest challenge was again the increase in construction costs, with 68.2% of respondents indicating that increased costs have had an impact on their construction projects. This is up from 64.3% in 2023. The next most common challenges were: budget shortfalls (61.1%, up from 57.6%); and staffing shortages (33.2%, down from 35.9%). (See Figure 29.)
Notably, the impact of supply chain disruptions seems to have eased from 2023. While 30.5% of respondents in 2024 indicated that their construction projects were challenged by supply chain disruptions, this is down from 39.3% who reported such disruptions in 2023.
Some of the “other” challenges and setbacks to construction named by respondents to the Industry Report survey include gaining community support, navigating bureaucracy, contractor scarcity, availability and rates for insurance coverage, and weather delays.
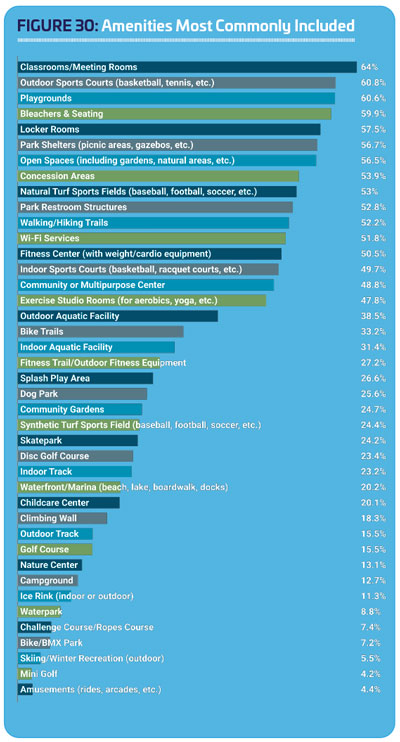
The top amenities included in respondents’ facilities in 2024 included: classrooms and meeting rooms (64% of all respondents have them); outdoor sports courts for basketball, tennis, volleyball, pickleball, etc. (60.8%); playgrounds (60.6%); bleachers and seating (59.9%); locker rooms (57.5%); park shelters like picnic pavilions and gazebos (56.7%); open spaces, including gardens and natural areas (56.5%); concession areas (53.9%); natural turf sports fields for baseball, football, soccer, etc. (53%); and park restroom structures (52.8%). (See Figure 30.)
While the prevalence of most amenities varies from year-to-year, there are some that have seen a significant increase over the past year. Amenities whose prevalence increased by at least five percentage points in the past year include: community or multipurpose centers (up 11.6 percentage points); splash play areas (up 9.4); park shelters (up 9.2); park restroom structures (up 9.1); bike trails (up 9); outdoor aquatic facilities (up 8.5); dog parks (up 8.2); skateparks (up 8.2); community gardens (up 7.9); indoor aquatic facilities (up 7.6); fitness trails and outdoor fitness equipment (up 6.5); bleachers and seating (up 6.5); open spaces (up 5.9); walking and hiking trails (up 5.8); indoor tracks (up 5.5); exercise studio spaces (up 5.3); natural turf sports fields (up 5.2); outdoor sports courts (up 5.1); and disc golf courses (up 5).
Park respondents were more likely than other respondents to include: park shelters (84.5%); playgrounds (83.9%); park restroom structures (81.1%); walking and hiking trails (75.4%); outdoor sports courts (75.1%); open spaces (73.3%); bleachers and seating (71.8%); natural turf sports fields (68.7%); concession areas (63.5%); bike trails (51.6%); outdoor aquatic facilities (49.7%); dog parks (45.3%); fitness trails and outdoor fitness equipment (40.7%); skateparks (43.3%); splash play areas (39.1%); community gardens (37.8%); disc golf courses (37%); golf courses (22.3%); ice rinks (15.3%); bike or BMX parks (13.2%); and skiing/outdoor winter recreation (8.3%).
Respondents from colleges and universities were the most likely to include: locker rooms (89.7%); indoor sports courts (85.3%); classrooms and meeting rooms (81.9%), exercise studio rooms (76.7%); synthetic turf sports fields (58.6%); indoor running tracks (58.6%); and climbing walls (45.7%).
School respondents were the most likely to include outdoor running tracks (41.4%).
Health club respondents were more likely than others to include fitness centers (93.2%).
Respondents from Ys were the most likely to include: childcare centers (70%); Wi-Fi (68.3%); and indoor aquatic facilities (68.3%).
Camp respondents were more likely than others to include: campgrounds (70%); waterfronts and marinas (54%); nature centers (26%) and challenge courses and ropes courses (26%).
Respondents from rec centers were the most likely to include: community or multipurpose centers (69.4%); waterparks (13%); amusements and arcades (10%); and mini golf (10%).
After a significant jump in 2023, this year the number of respondents who have plans to add features at their facilities over the next few years held steady. In 2024, 47% of respondents said they were planning to add features at their facilities, up slightly from 46.6% in 2023. This compares with 2022 (39.1%) and 2021 (37.1%), when less than 40% of respondents had plans to add features. (See Figure 31.)
In 2024, respondents from parks and camps were the most likely to have plans to add features at their facilities. Some 57.8% of park respondents said they were planning to add features, down from 62.6% in 2023, and 56.6% of camp respondents were planning to add features, representing no change from 2023. They were followed by Ys (45.9% had plans to add features, up from 41.3% in 2023), rec centers (45.5%, down from 48%) and schools (43.3%, up from 38.5%). Around one-third (33.1%) of college respondents in 2024 had plans to add features at their facilities, down from 35.8% in 2023. Health club respondents were the least likely in 2024 to be planning to add any features to their facilities, with just 14.9% indicating they had such plans, down from 19.5% in 2023.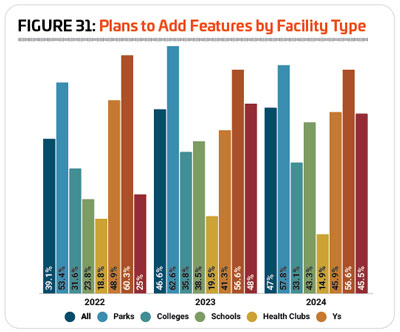
The top planned features for all facility types include:
1. Splash play areas (26.5% of respondents with plans to add features are planning to add splash play)
2. Fitness trails and outdoor fitness equipment (21.1%)
3. Park restroom structures (19%)
4. Park shelters (17.8%)
5. Playgrounds (17.6%)
6. Walking and hiking trails (17.3%)
7. Synthetic turf sports fields (17.3%)
8. Dog parks (16.4%)
9. Outdoor sports courts (14.3%)
10. Community gardens (13.6%)
Programming Trends
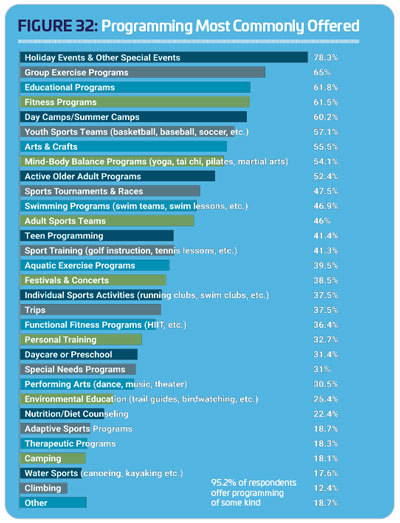
The vast majority of respondents provide programming of some kind at their facilities. In 2024, 95.2% of all respondents said they currently provide programming options to their members or communities, representing little change from 2023, when 95.8% offered programming, but down slightly from 2022 (96.4%) and 2021 (97.6%).
The 10 program types that are most commonly offered at respondents’ facilities include: holiday events and other special events (78.3% of respondents host holiday activities and special events); group exercise programs (65%); educational programs (61.8%); fitness programs (61.5%); day camps and summer camps (60.2%); youth sports teams (57.1%); arts and crafts (55.5%); mind-body balance programs such as yoga and tai chi (54.1%); programs for active older adults (52.4%); and sports tournaments and races (47.5%). (See Figure 32.)
2024 saw a great deal of growth in a large number of program types. The programs that saw an increase of at least five percentage points include: arts and crafts (up 11.9 percentage points); group exercise programs (up 11.5); festivals and concerts (up 10); active older adult programs (up 9.7); holiday events and other special events (up 9.2); mind-body balance programs (up 8.7); sports tournaments and races (up 7.9); adult sports teams (up 7.7); aquatic exercise programs (up 7.5); educational programs (up 6.8); swimming programs (up 6.6); special needs programs (up 6.6); sport training (up 6.4); fitness programs (up 6.2); adaptive sports programs (up 5.8); performing arts programs (up 5.3) and teen programming (up 5 percentage points).
A full 100% of Y respondents offer programming at their facilities, making them the most likely to provide programming of any kind. They were followed by parks (98.7%), rec centers (96.8%), camps (93.2%) and colleges (93%). More than nine out of 10 health club respondents (93.2%) and school respondents (92.3%) also said they currently offer programming at their facilities. 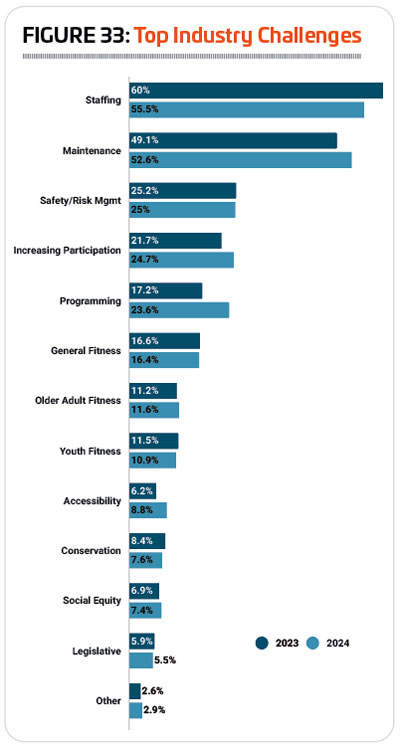
Parks respondents were more likely than others to offer sports tournaments and races, sport training such as golf instruction or tennis lessons, and festivals and concerts.
Respondents from colleges and universities were the most likely to offer adult sports teams and climbing programs.
Respondents from schools were more likely than others to offer performing arts programs.
Health club respondents were the most likely to offer fitness programs, functional fitness programs, and personal training.
Y respondents were more likely than others to offer holiday events and other special events, educational programs, day camps and summer camps, youth sports teams, mind-body balance programs like yoga and tai chi, swimming programs, teen programming, aquatic exercise programs, trips, individual sports activities, including running clubs, daycare or preschool programs, special needs programs, nutrition and diet counseling, and therapeutic programming.
Respondents from camps were the most likely to offer environmental education programs, camping programs, and water sports such as kayaking and canoeing.
Rec center respondents were the most likely to offer group exercise programs, arts and crafts programs, programs for active older adults, and adaptive sports programs.
In 2024, 43.7% of respondents said they had plans to add additional programming options at their facilities over the next three years. This is up slightly from 41.5% in 2023, and substantially from 2022, when 35.7% of respondents had such plans.
More than half of respondents from Ys (62.5%) and parks (50.2%) said they had plans to add programming at their facilities over the next few years. They were followed by rec centers (43%), camps (36.4%), and colleges (32.6%). Respondents from schools (19.2%) and health clubs (25%) were the least likely to be planning to add new programming options to their facilities.
The 10 most commonly planned program additions in 2024 were:
1. Environmental education programs (26.4%, up from 22.2% in 2023)
2. Educational programs (24.1%, down slightly from 24.8%)
3. Holiday events and other special events (23.8%, up from 18.1%)
4. Fitness programs (22.5%, up from 20.3%)
5. Mind-body balance programs (22.2%, down from 23.3%)
6. Adult sports teams (22.2%, up from 19.9%)
7. Teen programming (22.2%, down from 23.3%)
8. Programs for active older adults (22.2%, up from 19%)
9. Group exercise programs (20.6%, down from 22%)
10. Special needs programs (19.6%, up from 18.8%)
When asked about various initiatives their organizations are involved in, these 10 responses were the most common:
1. Wellness initiatives (52.2%, up from 45.7% in 2023)
2. Inclusion initiatives for those with physical disabilities (46%, up from 39.7%)
3. Inclusion initiatives for those with developmental disabilities (43.3%, up from 35%)
4. Outreach to economically disadvantaged populations (37.4%, up from 34.3%)
5. Outreach to underserved populations (37.1%, up from 32.9%)
6. Programs to connect people with nature (33.6%,up from 30.5%)
7. Outreach to minority populations (31.4%, up from 30.2%)
8. Disaster recovery assistance (30.4%, up from 24.5%)
9. Initiatives to reduce hunger and improve nutrition (23.4%, up from 21.6%)
10. Resource conservation and green initiatives (22.9%, up from 20.3%)
Top Industry Challenge? Still Staffing
Staffing troubles have dominated the list of top industry challenges for the past several years, though the pressure seems to be easing. More than half (55.5%) of all respondents in 2024 said staffing was a top challenge in the industry. This is down from 60% in 2023 and 63.2% in 2022. (See Figure 33.)
Respondents from Ys were the most likely to name staffing issues as a top industry challenge, with more than three-quarters (76.2%) of the respondents at Ys naming staffing a concern. They were followed by parks (58.3%) and rec centers (57.3%).
Given the relative age of many facilities, it comes as no surprise that equipment and facility maintenance was also a top concern, with 52.6% of all respondents naming it a top industry challenge. This is up from 49.1% in 2023. Respondents from colleges and universities (57.4%) and camps (57.1%) were the most likely to name equipment and facility maintenance a top concern for their facilities.
Safety and risk management was the next most commonly named industry challenge, with 25% of respondents indicating this was a problem. This represents virtually no change from 2023, when 25.2% of respondents called safety and risk management a top industry challenge. Respondents from schools (33.3%) and camps (31.4%) were the most likely to consider this a challenge.
Asked what their facilities’ top challenge has been over the course of the past years, respondents had a range of answers. Funding and budget issues were the most commonly named problem, as well as staffing problems and struggles with maintenance and aging infrastructure. Some respondents said they were still struggling to overcome the problems associated with COVID, and many cited inflationary pressure that has made it more difficult to stock items and make needed repairs. RM
