


Survey Methodology
This report is based on a survey conducted for Recreation Management by Stamats Inc., an independent research company. An e-mail was broadcast and respondents were invited to participate. From the launch of the survey on Jan. 4, 2024, to the closing of the survey on Feb. 27, 2024, 963 responses were received. The findings of this survey may be accepted as accurate, at a 95% confidence level, within a sampling tolerance of approximately +/- 3.1 percent.

With the impact of inflation over the past few years well-covered by the media (and felt by citizens of all stripes in their day-to-day expenses), we collected this year’s salary data with even more curiosity and interest than usual. Would salaries in recreation, sports, fitness and aquatic facilities increase along with increasing prices? And indeed, this year’s responses, while skewed a bit by a high mean, reflected an increase to median salaries of 8.5%.
Welcome to our 17th Annual Salary Survey! In these pages, we’ll show you the results to the Industry Report survey around issues of salary, salary increases (and expectations of increases), job satisfaction and more.
A Profile of Our Respondents
Editor’s Note: For more details on respondents to the Industry Report survey, including the types of organizations they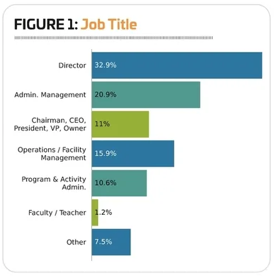 represent and the regions they hail from, read our Annual State of the Industry Report, featured in the June 2024 issue, and found online at recmanagement.com/industry-research.
Readers of Recreation Management magazine are generally in decision-making positions, from park district directors to CEOs of health clubs, from presidents of YMCAs to school district superintendents. So it’s not surprising that respondents to the Industry Report survey tend to be older professionals. Some 41.9% of respondents said they were at least 55 years old, and another 32% were between 45 and 54 years old. Around one-fifth (20.7%) of respondents were between the ages of 35 and 44. Just 5.3% of respondents were younger than 35.
When it comes to ethnicity, respondents to the survey were not diverse, with 88.8% indicating they were white, virtually unchanged from 2023, when 88.3% were white. Some 5.4% of respondents were Hispanic (up from 4.9% in 2023), 5% were black (up from 3.8%), 1% were Asian/Pacific Islanders (almost unchanged from 1.3%), and 0.9% were Native American or Alaskan Natives (unchanged). The remaining 0.9% represented “other” ethnicities.
Similarly to the readership of Recreation Management magazine, respondents tend to hold leadership positions. The largest number, 32.9%, said they were directors at their organizations. A little more than one-fifth (20.9%) were in administration and management positions, which includes the titles of administrator, manager or superintendent. Another 15.9% of respondents were in operations and facility management, including operations managers, facility managers, building managers and supervisors. Some 11% of respondents were the chairman, CEO, president, vice president or owner of their organizations. Program and activity administration job roles were held by 10.6% of respondents. This includes activity or program directors, managers, coordinators, specialists, coaches and instructors. A small number of respondents—just 1.2%—said they were faculty or teachers. Finally, 7.5% of respondents said they were in “other” job roles. (See Figure 1.)
Industry Report survey respondents are a well-educated group, with more than three-quarters (78%) reporting that they had earned at least a bachelor’s degree. Some 43.6% said they had a bachelor’s degree, 31.7% had a master’s degree, and 2.7% had earned an advanced degree, such as a Ph.D. Another 7.1% of respondents said they had earned a two-year degree, or associate’s, and 12.4% had attended college without earning a degree. Finally, 2.5% said they had earned a high school diploma as their highest level of educational attainment.
7,050 Years of Experience, Give or Take
When you add it all up, the combined industry experience of this year’s respondents to the Industry Report survey comes to more than 7,000 years. That’s a lot of know-how!
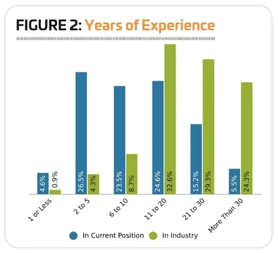
The average respondent has held their current position for 11.7 years, down from 13.3 in 2023 and 12.3 in 2022. Slightly more than a fifth (20.7%) have been in their current position for more than 20 years, representing no change over the past two years (20.8% in 2023 and 20.7% in 2022). Another 24.6% have been in their current position for 11 to 20 years, down from 26.4% in 2023, and 25.1% in 2022. Slightly fewer, 23.5%, have been in their current position for between six and 10 years, and 26.5% have held their current position for two to five years. Just 4.6% have held their current job for a year or less.
Respondents have logged nearly a quarter-century’s worth of industry knowledge, on average, with 23.3 years of industry experience. More than half (53.6%) said they have been working in the industry for at least 20 years, down just slightly from 54.5% in 2023. Almost a third (32.6%) have been working in the industry for 11 to 20 years. Smaller numbers have been involved in the industry for six to 10 years (8.7%), two to five years (4.3%), or one year or less (0.9%). (See Figure 2.)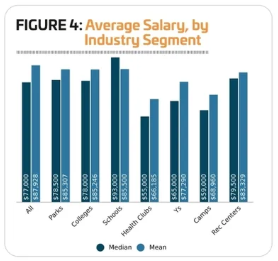
Earning Potential
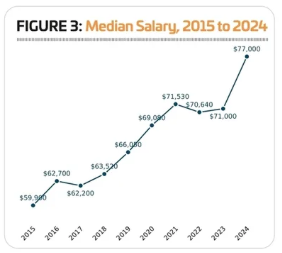
In 2024, the average respondents reported an annual salary of $87,928. The maximum salary reported was $250,000, and the median salary was $77,000. While the average salary was down 13% from 2023’s average of $101,090, the median salary was up 8.5% over the $71,000 reported last year. (See Figure 3.)
The highest average salaries in 2024—both mean and median—were reported by respondents working for schools and school districts. School respondents reported earning a mean salary of $85,500 in 2024, with a median of $93,000. In terms of mean salaries, they were followed by respondents from parks (with a mean salary of $85,307) and colleges ($85,246). However, respondents from rec centers had the second-highest median salaries, at $79,500, followed by parks ($78,500). (See Figure 4.)
The lowest salaries in 2024—both mean and median—were reported by respondents from health clubs. Health club respondents reported earning a mean salary of $66,185 in 2024, with a median salary of $55,000. They were followed by respondents from camps, with a mean of $68,960 and a median of $59,000, as well as Ys, with a mean of $77,290 and a median of $65,000.
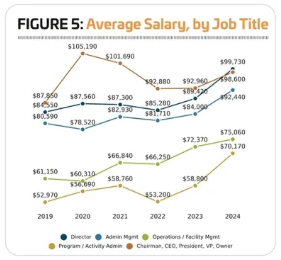
Considered in terms of job roles, the highest-paid respondents held director-level positions, representing a change from past years, when those in the role of CEO, president or similar positions of responsibility reported the highest salaries. Directors in 2024 earned an average base salary of $99,730, while CEOs, presidents and the like earned an average of $98,600. That said, nearly half (46%) of CEO respondents reported earning an annual base salary of at least $100,000, compared with 37.5% of director respondents.
All types of job roles in 2024 reported increases to their annual base salary over the averages reported in 2023. The greatest increase was reported by the respondents who earn the lowest average salary overall—those in program and activity administration, who saw a 19.3% increase to the average salary reported in 2023 ($58,800) to an average of $70,170 in 2024. They were followed by directors, who reported an 11.5% increase from $89,420 in 2023 to $99,730 in 2024. Respondents in administration and management positions also reported a double-digit increase, with a 10% jump from $84,000 in 2023 to $92,440 in 2024. CEO respondents and those in operations and facility management reported smaller increases, at 6.1% and 3.7%, respectively. (See Figure 5.)
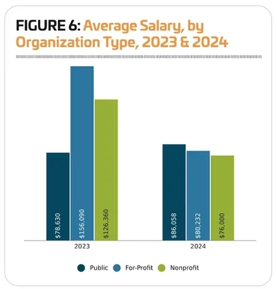
Just as those holding director-level positions overtook those in CEO and president-type roles to earn the highest salaries in 2024, respondents in public and governmental organizations earned higher average salaries than those in private organizations, both for-profit and nonprofit. Respondents from public and governmental organizations earned an average salary in 2024 of $86,058, a 9.4% increase from 2023. Respondents working for private, for-profit organizations had the second-highest average salary when it comes to organization type, earning $80,232 on average in 2024, while those working for private nonprofits earned an average of $76,000. (See Figure 6.)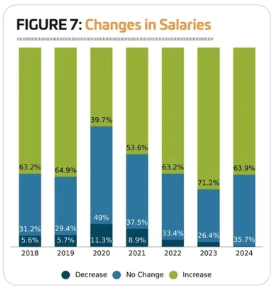
With the inflationary pressures over the past couple of years driving wage increases for all types of professions, it should come as no surprise that respondents were more likely than ever to report that their salaries in 2023 had increased. More than seven in 10 (71.2%) of respondents to this year’s survey said they saw a raise in 2023, with an average increase of 5.6% (and a median increase of 4%). Another 26.4% of respondents said their salaries remained unchanged in 2023, while 2.4% reported a decrease. (See Figure 7.)
Looking forward, nearly two-thirds (63.9%) of respondents said they expect their salaries in 2024 to be higher than in 2023. These respondents are anticipating an average increase of 5.2% (with a median increase of 4%). More than a third (35.7%) said they expect no change to their salaries in 2024, and just 0.3% expect their salaries to decline.
Hard at Work
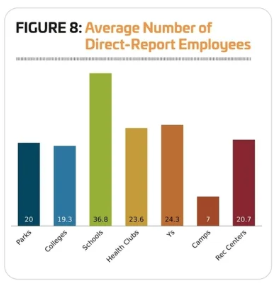
On average, respondents in 2024 said they have 21 employees reporting directly to them, up from 18.5 in 2023. The greatest number of direct-report employees was 400 (down from 600), and the median was eight (no change).
Once again respondents from schools had the largest number of direct-report employees, with an average of 36.8. The largest number of employees for school respondents was 100, and the median was 25. Respondents from camps had the smallest number of direct-report employees, with an average of just seven. The largest number of employees for camp respondents was 35, and the median was just five. All other facility types fell more closely in line with the average for all respondents, ranging from a low of 19.3 for colleges and universities to a high of 24.3 for Ys. (See Figure 8.)
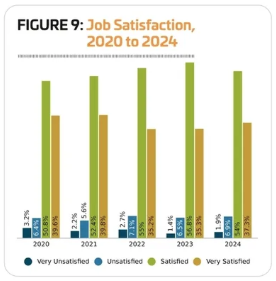
When it comes to happiness in their current roles, respondents to the Industry Report survey are generally satisfied with their work. Though their was a slight increase in the number of respondents reporting dissatisfaction in 2024 over 2023 (from 7.9% to 8.8%), the vast majority of respondents are satisfied with their work, with 91.3% of respondents in 2024 indicating they are either satisfied (54%, down from 56.8% in 2023) or very satisfied (37.3%, up from 35.3%) in their current positions. (See Figure 9.)
Respondents from Ys were once again the most content with their current positions. Some 95.3% of Y respondents said they are either satisfied (55.8%) or very satisfied (39.5%) in their current roles. They were followed by respondents from camps (94%), parks (92.4%) and rec centers (91.9%). And though smaller numbers reported being satisfied in their current positions, substantial majorities of respondents from health clubs (88.3%), colleges and universities (85.5%) and schools (80.9%) said they are satisfied with their current roles. RM
