


 In this section of the Industry Report, we’ll dive into the answers provided by survey respondents whose facilities include aquatic elements—any respondent who has at least one indoor or outdoor pool, splash play area, waterpark, or hot tub.
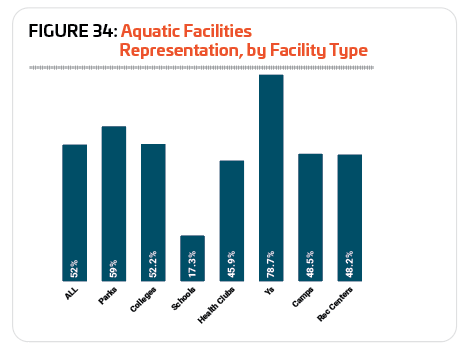
In 2025, more than half (52%) of respondents reported that they included aquatic elements among their facilities, down from 62.5% in 2024, but still well above 2023, when 45.2% of respondents had aquatic facilities.
Respondents from Ys were by far the most likely to include aquatics at their facilities. More than three-quarters (78.7%) of Y respondents said they had pools or other aquatic elements at their facilities. More than half of respondents from parks (59%) and colleges (52.2%) had aquatics, while less than half of respondents from camps (48.5%), rec centers (48.2%), and health clubs (45.9%) included aquatic amenities. School respondents were the least likely to include aquatic elements at their facilities, with just 17.3% indicating that they had swimming pools or other aquatic amenities. (See Figure 34.)
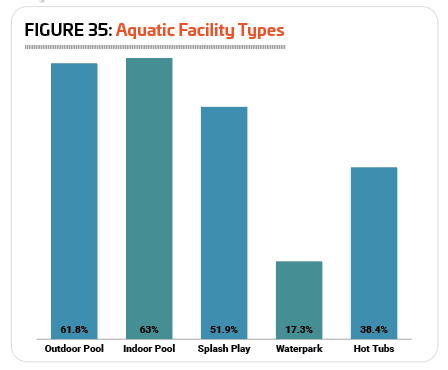 In most years, the most common type of aquatic facility covered by the Industry Report is outdoor pools, but in 2025, more aquatic respondents had indoor pools (63%) than outdoor pools (61.8%). In 2024, 54.5% of respondents had indoor pools, and 68.2% had outdoor pools.
Splash play areas were also common among aquatic respondents, with 51.9% indicating they have at least one splash play area. This is down slightly from 55.1% in 2024, but well above the number reported in 2023, 39.5%.
Some 38.4% of aquatic respondents said they have at least one hot tub, spa, or whirlpool, up from 30.9%; and 17.3% said they have at least one waterpark, virtually unchanged from 17.4% in 2024. (See Figure 35.)
While indoor pools continued to be most prevalent in the colder climates of the Northeast and Midwest, more respondents in the other regions of the country have indoor pools than in past years of the survey. Some 72.3% of respondents in the Northeast and 64.7% in the Midwest said they had at least one indoor pool, up from 68.7% and 63.5%, respectively. But the real increases were seen in the South Atlantic (from 40% in 2024 to 63.5% in 2025), West (56.2% to 62.2%), and South Central (42.6% to 52.9%) regions.
Outdoor pools were much more common in the warmer regions of the country with respondents in the South Central region most likely to report that they had at least one outdoor pool. Some 84.4% of South Central respondents said they had an outdoor pool, up from 71.4% in 2024. They were followed by the West, where 73.6% of respondents had at least one outdoor pool, up from 67.9%. There was a slight decrease in the number of respondents in the South Atlantic region who had an outdoor pool, from 69.8% in 2024 to 66.7% in 2025. Fewer than half of respondents in the Northeast (48.8%) and Midwest (48.1%) had an outdoor pool, down from 63.8% and 64.5%, respectively.
As in past years, splash play areas continued to be most common in the Southern and Western regions of the U.S. Some 56.8% of residents in the South Central region, 55.7% in the West, and 55.1% in the South Atlantic region said they had at least one splash play area. While this represents a slight increase for the South Atlantic (from 52.5% in 2025), the percentage of respondents in the West and South Central regions with splash play areas fell slightly, from 62% and 61.9%, respectively. More than half of respondents in the Midwest (50.4%) said they had at least one splash play area, representing little change from 2024 (49.4%). Respondents in the Northeast were least likely to have splash play areas, with 34.6% indicating they had at least one, down from 45.2% in 2024.
Hot tubs, spas, and whirlpools were far more common among facilities in the Western region of the U.S., with more than half (50.6%) of aquatic respondents in the West indicating that they had at least one, up from 41.2% in 2024. They were followed by the South Central region (39%, up from 20.5%), and the Midwest (36%, up from 34.1%). One-third of respondents (33.3%) in the South Atlantic region said they had at least one hot tub, up from 22.2% in 2024. Respondents in the Northeast were least likely to have hot tubs, though 28.9% said they had at least one, relatively unchanged from 27.5% in 2024.
Waterparks were most common in the South Central region, where 21.6% of respondents said they had a waterpark. They were followed by the West (21.1%), South Atlantic (20.6%), and Midwest (18.1%). Respondents in the Northeast were least likely to have waterparks, with just 10.4% indicating they had at least one.
Indoor swimming pools were far more common for Ys, schools, colleges, and health clubs than for other types of facilities. Some 95.8% of Y respondents with aquatics, 89.3% of school respondents, 89% of college respondents, and 88% of health club respondents said they had at least one indoor swimming pool. They were followed by rec centers, where 62.8% of respondents said they had an indoor pool. Parks (39.9%) and camp (10%) respondents were the least likely to have indoor swimming pools.
Conversely, respondents from camps and parks were the most likely to have at least one outdoor swimming pool. Some 87.9% of camp respondents and 71.4% of park respondents said they had outdoor pools. They were followed by respondents from health clubs (68.2%) and rec centers (63.4%). Less than half of respondents from Ys (45.4%) had outdoor swimming pools, and respondents from colleges (31.3%) and schools (22.7%) were the least likely to have outdoor pools.
Splash play areas were most commonly found among park respondents’ facilities, with more than three-quarters (76.2%) indicating they had at least one splash play area, up from 71.6% in 2024 and 63.2% in 2023. They were followed by rec centers, where 64.9% had at least one splash play area, representing little change from 2024 (64.7%). Nearly half (47.4%) of health club respondents in 2025 said they had a splash play area, while 31.4% of Y respondents had at least one. Splash play was least common for camps (28.6%), schools (14.3%), and colleges (11.1%).
Hot tubs, spas, and whirlpools were more common by far for health club respondents than for any other type of facility. Some 87% of health club respondents said they had at least one hot tub. They were followed by Ys (52.3%), colleges (45.8%), and rec centers (43.6%). Respondents from parks (21.9%), camps (17.9%), and schools (14.3%) were least likely to have at least one hot tub.
Finally, park respondents were far more likely to have waterparks than any other type of responden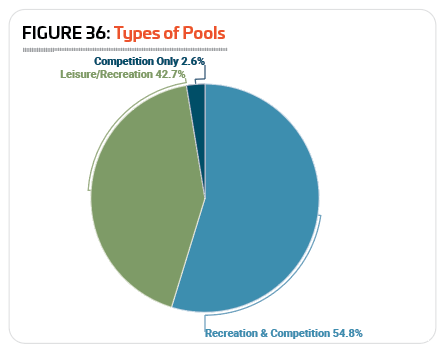 t. Nearly 50 (48) park respondents with aquatics said they had at least one waterpark.
Aquatic facilities were most likely to be used for both recreation and competitive purposes, with 54.8% of respondents indicating their facilities hosted a combination of recreational and competitive activities. Another 42.7% of respondents said their pools are used for recreational purposes only, and just 2.6% said their facilities are used for competitive activities only. (See Figure 36.)
Competition pools were most likely to be found at school respondents’ facilities, with 23.1% of school respondents with aquatics indicating their pools were used for competitive purposes. They were followed by colleges, where 8.6% of respondents had competition pools. Just one park respondent and one rec center respondent also said they had competition-only pools, and no respondents from health clubs, Ys, or camps said their pools were used just for competitive activities.
Y respondents were the most likely to report that their aquatic facilities serve both recreational and competitive purposes. Nearly three-quarters (73.2%) of Y respondents said their aquatic facilities were used for both leisure and competition. They were followed by schools (65.4%), colleges (59.1%), health clubs (57.7%), and parks (56.2%). Slightly less than half (49%) of respondents from rec centers said their aquatic facilities were for both recreation and competition, and camp respondents (6.5%) were the least likely to use their aquatic facilities for any sort of competitive events, even in combination with recreational programming.
The other 93.5% of camp respondents said their aquatic facilities are used for recreational activities only, making them by far the most likely to have pools and aquatic facilities dedicated to solely recreational purposes. Less than half of respondents from rec centers (49%), parks (43.4%), and health clubs (42.3%) said their aquatic facilities were for recreational purposes. Respondents from schools (11.5%), Ys (26.8%), and colleges (32.3%) were the least likely to use their aquatic facilities only for recreational activities.
Aquatic Budgets & Costs
In 2024, respondents whose facilities include aquatics had a 97.8% higher average operating cost than those without aquatics at their facilities. Aquatic respondents had an average overall operating cost of $4,470,000 in 2024, compared with $2,260,000 for non-aquatic respondents.
While they spent nearly twice as much on operating costs, aquatic respondents are expecting their average costs to increase much more slowly over the next two years than non-aquatic respondents. Aquatic respondents projected a 9.8% increase to their overall operating costs, to an average of $4,910,000 in 2026, while non-aquatic respondents expect their operating costs to grow by 21.7% in the same time frame, to an average of $2,750,000.
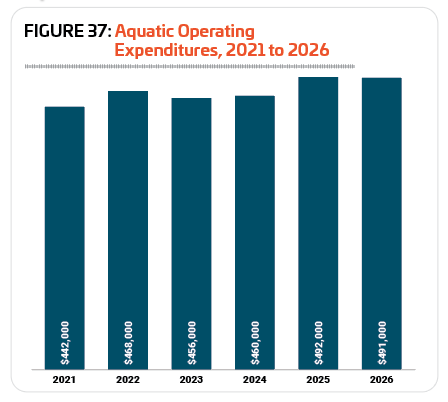
When it comes to their operating costs dedicated solely to the aquatic side of the operations, respondents reported a very slight 0.9% increase to average expenditures from 2023 to 2024, from $456,000 to $460,000. Looking forward, aquatic respondents projected a 6.7% increase to the cost of their aquatic operations from 2024 to 2026, to an average of $491,000. (See Figure 37.)
Respondents from Ys and parks reported the highest average aquatic operating costs in 2024. Y respondents had the highest average operating cost, at $542,000, followed by parks at $537,000—the only respondent cohort spending more than the average aquatic operating cost for all respondents. Spending less than that average were respondents from schools ($364,000), colleges ($357,000), health clubs ($324,000), and rec centers ($320,000). Camp respondents had the lowest average aquatic operating expenditures in 2024, at $264,000.
From 2024 to 2026, respondents from rec centers are anticipating the greatest increase to their aquatic costs. Rec center respondents projected a 27.8% increase to their average operating cost, from $320,000 in 2024 to $409,000 in 2026. They were followed by park respondents, who projected a 13% increase to their average aquatic costs, from $537,000 in 2024 to $607,000 in 2026. Respondents from schools, health clubs, and colleges projected smaller increases to aquatic costs, with schools expecting a 7.1% increase ($364,000 to $390,000), health clubs expecting a 3.7% increase ($324,000 to $336,000), and colleges expecting a 1.7% increase ($357,000 to $363,00).
Respondents from Ys and camps reported that they expect their aquatic operating expenses to decrease from 2024 to 2026. Y respondents projected a 2.4% decrease, from an average of $542,000 in 2024 to $529,000 in 2026, and camp respondents are expecting a very slight decline of 0.8%, from $264,000 in 2024 to $262,000 in 2026.
From 2023 to 2024, 39.5% of aquatic respondents said their aquatic revenues increased, while 52.3% reported no change, and 8.2% reported a decrease. This represents a slight stabilization over the previous year, as 48.9% of respondents reported an increase to aquatic revenues from 2022 to 2023, with 39.2% reporting no change and 12% reporting a decrease.
Respondents from Ys were the most likely to report that their aquatic revenues had increased from 2023 to 2024. Some 57.3% of Y respondents said they had seen an increase in aquatic revenues in that time period. They were followed by rec centers (42.5%), parks (41.4%), and health clubs (33.3%). Fewer respondents from colleges (25.6%), camps (21.4%), and schools (11.5%) said their aquatic revenues increased from 2023 to 2024.
In 2025, most respondents (52.1%) expect their aquatic revenues to remain the same as 2024. Another 41.3% are expecting aquatic revenues to increase, while 6.5% are expecting aquatic revenues to decrease in 2025.
Respondents from Ys were the most likely to be expecting their aquatic revenues to increase in 2025, with two-thirds (66.7%) indicating they are anticipating such an increase. They were followed by rec centers (48.8%), parks (45.2%), and health clubs (33.3%). Respondents from schools (4%), colleges (16.9%), and camps (22.2%) were the least likely to be expecting an increase to aquatic revenues in 2025.
Looking forward, 43.4% of aquatic respondents said they expect their aquatic revenues to increase from 2025 to 2026. More than half (52.8%) are expecting their aquatic revenues to remain the same in that time period, while 3.9% are anticipating a decrease.
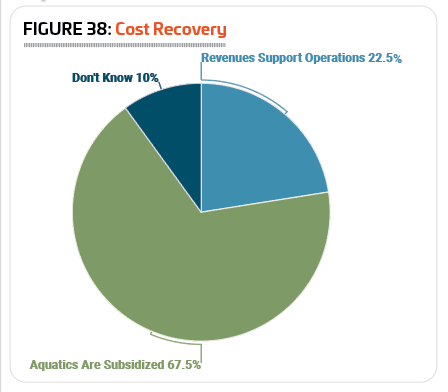
In 2025, some 22.5% of aquatic respondents said that their aquatic operations are fully supported by aquatic revenues. This is up slightly from 2024, when 20.3% of respondents said the same. Another 67.5% of respondents said their aquatic facilities are subsidized via funding from other sources, down from 70.4% in 2024, and 10% were unsure whether their aquatic revenues supported their aquatic operations. (See Figure 38.)
Respondents from health clubs,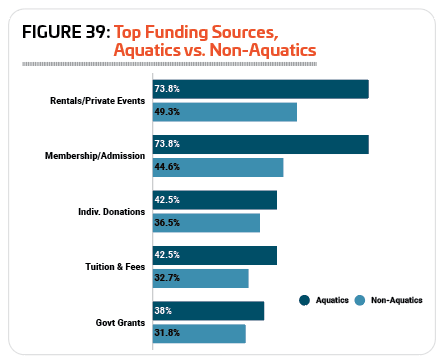 rec centers, and Ys were the most likely to report that their aquatic costs were paid for via aquatic revenues. Some 36.4% of health club respondents, 34.1% of rec center respondents, and 32.4% of Y respondents said their aquatic revenues covered their aquatic operating costs.
On the other hand, respondents from parks, camps, and colleges were the most likely to report that their aquatic operating costs were subsidized via funding from other sources. Some 73.2% of park respondents, 67.9% of camp respondents, and 66.2% of college respondents said their aquatic operations were subsidized with funding from other sources.
The most common sources of funding for aquatic facilities in 2025 were rentals and private events, and membership and admission fees. Some 73.8% of aquatic respondents said that facility rentals and private events were a source of funding for their facilities. This compares with 49.3% of non-aquatic respondents. The same number—73.8%—of aquatic respondents received facility funding through membership and admission fees. This compares with 44.6% of non-aquatic respondents. Other common sources of funding for aquatic facilities include: private donations from individuals (42.5%, vs. 36.5% of non-aquatic respondents); tuition and fees (42.5% vs. 32.7%); and government grants (38% vs. 31.8%). (See Figure 39.)
As usual, respondents with aquatic facilities were more likely than those without aquatics to report that they had taken action to reduce their operating expenses over the past few years. Some 81.4% of aquatic respondents said they had taken such action, down from 87.4% in 2024, while 76.9% of non-aquatic respondents had done so, virtually unchanged from 76.1% in 2024.
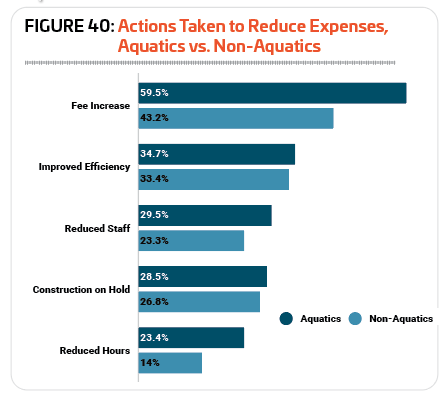
The most common methods used by aquatic respondents to reduce their operating costs were: increasing fees (59.5%, compared with 43.2% of non-aquatic respondents); improving energy efficiency (34.7% vs. 33.4%); staff reductions (29.5% vs. 23.3%); putting construction or renovation plans on hold (28.5% vs. 26.8%); and reducing their hours of operation (23.4% vs. 14%). (See Figure 40.)
Programming
Most aquatic respondents—94%—said that they currently provide aquatic programming at their facilities. That can include anything from the basics of learn-to-swim and water safety to competitive programs like swim teams and water polo to aquatic exercise and more.
A full 100% of aquatic respondents from colleges, schools, health clubs, and Ys said they currently host at least one sort of aquatic program at their facilities. In addition, 93.3% of rec center respondents, 92.6% of camp respondents, and 90.6% of park respondents offer aquatic programming of some kind.
The 10 most common aquatic programs in 2025 were:
1. Leisure swim (84.7%)
2. Learn-to-swim for children (77.8%)
3. Lap swim (75.9%)
4. Lifeguard training (72.2%)
5. Aquatic exercise programs (63.1%)
6. Learn-to-swim for adults (58.3%)
7. Youth swim teams (57.8%)
8. Water safety programs (53.9%)
9. Swim meets and competitions (48%)
10. Special needs aquatics programs (36.1%)
 Most of these program types saw either no change or a slight decrease in the percentage of respondents offering them from 2024 to 2025. The exceptions are youth swim teams, up 3.1 percentage points, and special needs aquatic programs, up 2.7 percentage points.
Well recognized for their outstanding aquatic programming, it should come as no surprise that Ys are the most likely to offer the most different types of aquatic programs. They were more likely than other respondents to host leisure swim, learn-to-swim for both children and adults, lap swimming, lifeguard training, aquatic exercise programs, youth swim teams, water safety programs, and special needs aquatics programs.
Respondents from colleges and universities were the most likely to have adult swim teams and water polo programs. School respondents were the most likely to host swim meets and competitions, school swim teams, and diving or diving team programs. Finally, health club respondents were the most likely to have aqua-therapy programs.
Some 15.7% of aquatic respondents in 202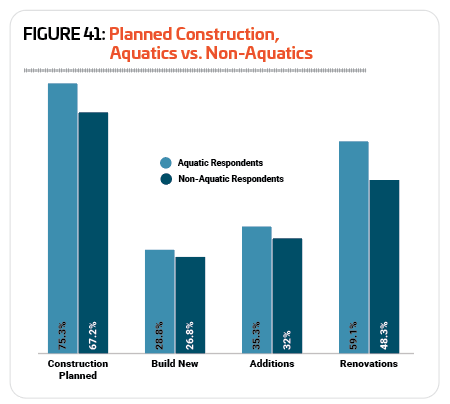 5 said they were planning to add aquatic programs to their facilities’ lineup over the next few years. This is down from 25% in 2024, and 22.6% in 2023.
Respondents from schools were the most likely to be planning to add more aquatic programs to their facilities. Nearly one-quarter (24.1%) of school respondents said they had such plans, up from 15.4% in 2024. They were followed by Ys, where 18.8% were planning to add aquatic programs, down from 41% in 2024, and health clubs where 17.9% were planning program additions, down from 29.4%. Some 16.5% of college respondents planned to add programs (down from 28.6%), as well as 14.5% of rec center respondents (down from 23.4%), and 14.1% of park respondents (down from 22.2%). Respondents from camps were the least likely to be planning aquatic program additions at their facilities, with just 12.1% indicating they had such plans, down from 28.6% in 2024.
The 10 most commonly planned aquatic program additions in 2025 were:
1. Special needs aquatic programs (planned by 34.2% of those who will be adding programs, down from 39.5%)
2. Learn-to-swim for adults (30.8%, up from 27.4%)
3. Aquatic exercise programs (19.7%, down from 33.1%)
4. Adult swim teams (17.1%, up from 13.7%)
5. Water safety programs (16.2%, up from 15.3%)
6. Aqua-therapy (15.4%, down from 20.2%)
7. Learn-to-swim for children (14.5%, down from 21%)
8. Swim meets and competitions (13.7%, down from 14.5%)
9. Water polo (12.8%, up from 11.3%)
10. Lifeguard training (11.1%, down from 18.5%)
Aquatic Facility Features & Construction
Around three-quarters (75.3%) of aquatic respondents in 2025 said they were planning construction at their facilities over the next few years. This is down from 80.2% in 2024, but still well above 2023, when 66.8% of aquatic respondents had plans for construction. Aquatic respondents in 2025 were somewhat more likely to have construction plans than non-aquatic respondents, 67.2% of whom said they were planning construction, down from 73.2% in 2024.
Aquatic respondents were more likely than non-aquatic respondents to be planning construction of every kind, including new construction (28.8% vs. 26.8%), additions (35.3% vs. 32%), and renovations (59.1% vs. 48.3%). (See Figure 41.)
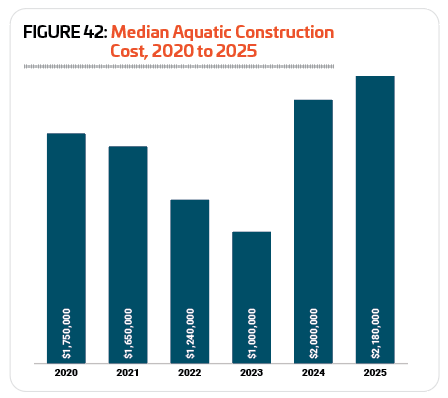
Aquatic respondents were also planning to spend more on their construction projects than non-aquatic respondents. In 2025, the median construction budget for aquatic respondents was $2,180,000, a 9% increase from 2024, when the median construction cost for aquatic respondents was $2 million. Construction spending for aquatic respondents in 2025 is 98.2% higher than for non-aquatic respondents, who reported a median construction cost of $1,100,000. (See Figure 42.)
The top 10 features covered by this survey that were most commonly found in aquatic respondents’ facilities in 2025 include:
1. Pool lifts and accessibility equipment (69.8% of aquatic respondents had pool lifts in 2025, down from 73.5% in 2024)
2. Automatic chemical feeders (68.6%, down from 72.3%)
3. Diving boards (42.6%, down from 49.1%)
4. Zero-depth entry (41.4%, down from 43.7%)
5. Waterslides (34.6%, down from 40.6%)
6. Water play structures (32.1%, down from 37.3%)
7. Splash pads (27.5%, down from 32.2%)
8. UV disinfection (24.4%, down from 29.3%)
9. Variable speed pumps (19.3%, down from 23.2%)
10. Pool inflatables (16.1%, down from 17.6%)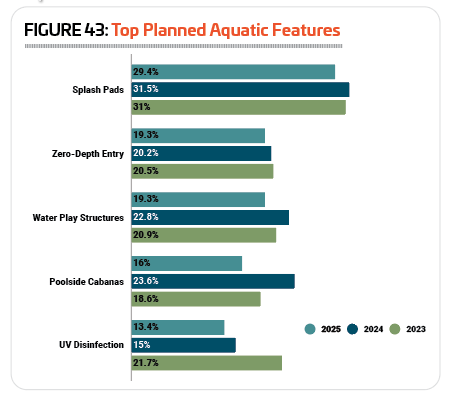
Aquatic respondents from parks and park districts were more likely than other respondents to include splash pads (49.8% of park respondents had splash pads, up from 43.7% in 2024), waterslides (49.3%), water play structures (46.7%), variable speed pumps (23.8%), variable frequency drives (20.2%), poolside cabanas (14.9%), poolside climbing walls (12.8%), wave pools (2.2%), and surf machines (2.2%).
College respondents were the most likely to include pool inflatables (20.8% of college respondents with aquatic facilities had pool inflatables), ozone systems (9.7%), and solar pool heating systems (4.2%).
Aquatic respondents from schools and school districts were the most likely to have diving boards (69.6%), and saline chlorination systems (21.7%).
Health club respondents were more likely than others to have AOP (advanced oxidation process) systems (5%), a type of secondary disinfection system.
Y respondents were the most likely to have pool lifts and accessibility equipment (81.3%), automatic chemical feeders (74.8%), and UV disinfection systems (29%).
Finally, aquatic respondents from rec centers were the most likely to have zero-depth entry pools (56.1%), lazy rivers (19.5%), and pool obstacle or ninja courses (4.9%).
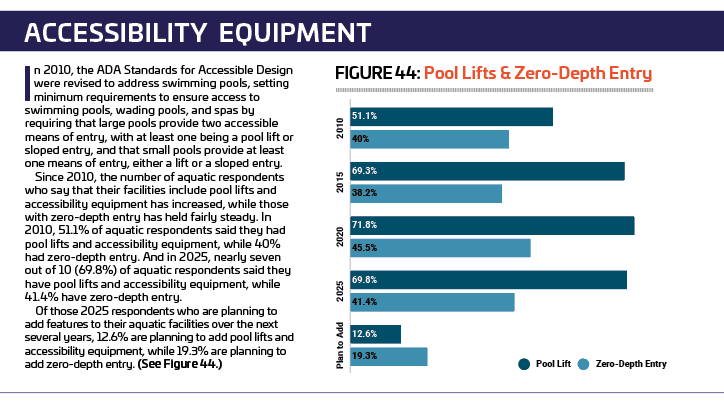
Some 16% of aquatic respondents in 2025 said they had plans to add features to their aquatic facilities over the next several years, down from 25.6% in 2024 and 22.5% in 2023. Respondents from rec centers, parks and Ys were the most likely to have such plans, with 20% of rec center respondents, 18.9% of park respondents, and 18% of Y respondents with aquatics indicating they were planning to add amenities to their facilities. They were followed by health clubs (17.9%), camps (15.2%), and schools (10.3%). Aquatic respondents from colleges and universities were the least likely to be planning to add features to their facilities, with just 7.2% indicating they would do so over the next few years.
As has been the case since 2012, the most commonly planned addition for aquatic facilities in 2025 was again splash pads. Some 29.4% of aquatic respondents with plans to add any features to their facilities said they would be adding splash pads, down from 31.5% in 2024 and 31% in 2023. Other commonly planned additions for aquatic facilities in 2025 included: zero-depth entry (19.3%, down just slightly from 20.2% in 2024 and 20.5% in 2023); water play structures (19.3%, down from 22.8% in 2024 and 20.9% in 2023); poolside cabanas (16%, down from 23.6% in 2024 and 18.6% in 2023); and UV disinfection systems (13.4%, down from 15% in 2024 and 21.7% in 2023). (See Figure 43.) RM
