


Over these eight pages, we’ll be studying the survey responses from schools and school districts. These respondents made up 11.8% of the entire survey population in 2025.
The largest number of school respondents were located in the Midwest in 2025. Some 41.6% of school respondents said they call the Midwest home. Another 17.8% were located in the Northeast, and the same number, 17.8% were located in the West. Smaller numbers of school respondents were from the South, with 13.9% from the South Central region, and 8.9% from the South Atlantic region of the U.S.
More than half (50.5%) of the respondents from schools and school districts said they were located in rural communities. Another 36.6% were located in suburban communities, and 12.9% were located in urban areas.
A majority of school respondents said they worked for public schools, with 88.1% indicating they worked for public organizations. Another 7.7% said they worked for private, nonprofit schools, and 3.6% worked with private for-profit schools. Another 0.6% worked for an “other” type of organization.
The average population size served by school respondents in 2025 was 17,030 people, with a median of 3,680. According to the National Center for Education Statistics, the largest school district in the U.S. is New York City Public Schools. In 2023-24, the NYC school system served more than 912,000 students. At the other end of the spectrum is the Bois Blanc Pines School District in Michigan, with just three students for the 2024-25 school year.
On average, school respondents said they manage 7.9 individual facilities, up from 5.3 in 2024. More than half (54.3%) of school respondents said they manage between one and three individual facilities, compared with 60.4% of non-school respondents. Another 29.9% of school respondents manage between four and nine individual facilities, compared with 20.7% of non-school respondents. And 15.9% of school respondents manage 10 or more individual facilities, compared with 18.8% of non-school respondents.
Respondents from schools and school districts in 2025 were much more likely to report that they had partnered with other organizations. Some 95.2% of school respondents said they had formed such partnerships, up from 84% in 2024. This compares with 86.2% of non-school respondents in 2025 who said they had partnered with other organizations. 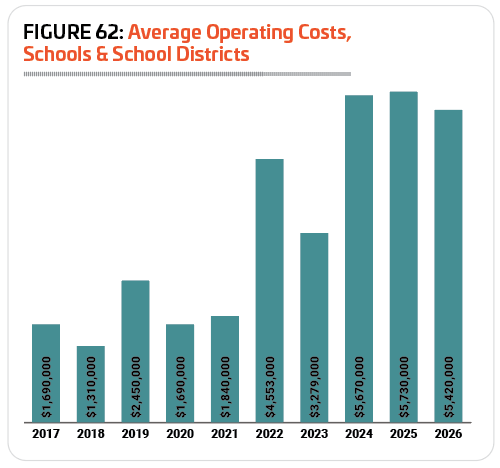
The most common partners for school respondents in 2025 were: other local schools (75.4% of school respondents had partnered with other local schools); local government (58.7%); state government (53.2%); federal government (38.9%); and nonprofit organizations (31.7%).
When it comes to the age group they typically work with at their facilities, school respondents were most likely to report that teens between the ages of 13 and 18 made up their primary audience. Some 61.7% of school respondents said their main audience was made up of teenagers, compared with just 3.6% of non-school respondents. Another 21.8% of school respondents said they primarily reach all ages, while 11.3% said they primarily work with children from 4 to 12 years old. Much smaller numbers of school respondents said their primary audience was made up of infants and toddlers (3%), or adults (2.3%).
School & School District Budgets & Costs
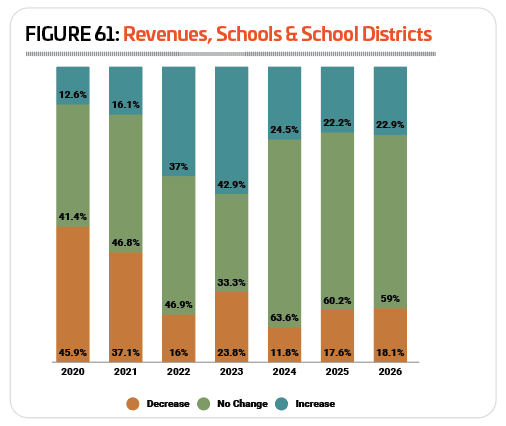
In most years, respondents from schools report little change to their revenues, with a majority seeing no change from one year to the next. The COVID pandemic upset that trend, and it is only in 2024 that we begin to see a return to the typical pattern. Some 63.6% of school respondents said their revenues remained the same from 2023 to 2024—nearly double the number who reported no change from 2022 to 2023 (33.3%). Nearly one-quarter (24.5%) of school respondents said their revenues increased in 2024, while 11.8% saw a decrease. (See Figure 61.)
 The pattern holds for 2025 and 2026, with 60.2% of school respondents expecting their revenues to remain the same in 2025, and 59% expecting their revenues to remain the same in 2026. Another 22.2% and 22.9%, respectively, are anticipating their revenues to increase in 2025 and 2026. And 17.6% expect a drop in revenues in 2025, with 18.1% expecting a decline in revenues in 2026.
In 2024, school respondents spent an average of $5,670,000 on their operating expenses, 72.9% more than the average for 2023 of $3,279,000. However, while the average skewed high, the median expenditure for schools in 2024 was just $880,000.
Looking forward, school respondents are expecting their average operating cost to increase 1.1% in 2025, to $5,730,000. After that they projected a 5.4% decrease to revenues in 2026, to an average of $5,420,000. (See Figure 62.)
On average, school respondents earn back 47.2% of their costs via revenue. Some 36.3% of school respondents said they earn back 30% or less of their costs via revenues, compared with 26.9% of non-school respondents. On the other hand, 27.5% of school respondents said they earn back more than 70% of their operating costs via revenues, compared with 33.6% of non-school respondents.
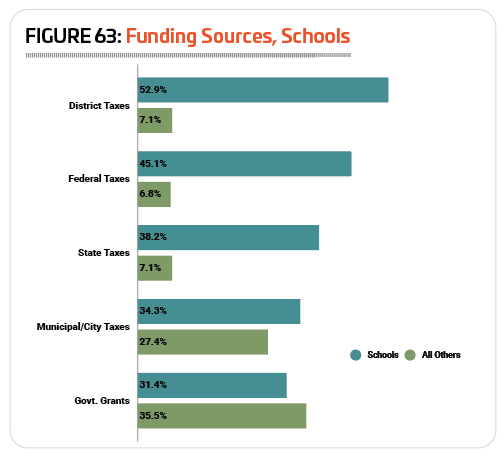
 The way school respondents’ facilities are funded differed vastly from the average respondent. The most common source of funding for schools in 2025 was district taxes. Some 52.9% of school respondents said their facilities were funded via district taxes, versus just 7.1% of non-school respondents. Another 45.1% of school respondents received funding via federal tax dollars, compared with just 6.8% of non-school respondents. And 38.2% of school respondents received funding for their facilities via state taxes, compared with just 7.1% of non-school respondents. More than three in 10 school respondents also got funding for their facilities from municipal and city taxes (34.3%), or from government grants (31.4%). (See Figure 63.)
School respondents were among the least likely to report in 2025 that they had taken action over the past several years to reduce their operating expenses. Just 60% of school respondents in 2025 said they had done so, down from 90.5% in 2024, but more similar to the numbers from 2023 (73.4%) and 2022 (63.8%). This compares with 81.3% of non-school respondents in 2025 who had taken action to reduce their operating costs.
School respondents were most likely to say that they had improved their facilities’ energy efficiency in order to reduce their operating costs. Some 29% of school respondents had improved their energy efficiency, down from 57.1% in 2024. The next most common actions school respondents had taken to reduce their operating costs were: putting construction or renovation plans on hold (22% of school respondents had taken this step to reduce their costs); increasing fees (20%); reducing staff (13%); and cutting programs or services (10%).
School Facility Use & Construction Plans
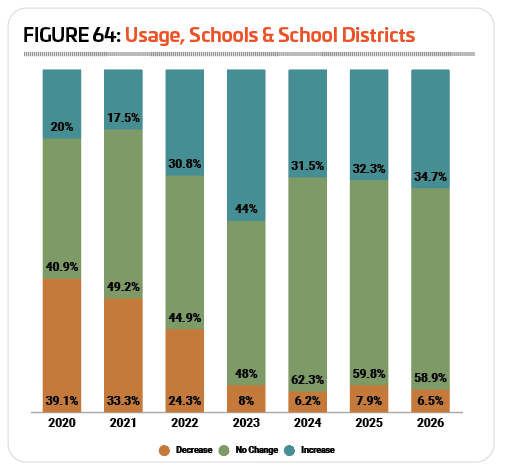
Similar to the case with revenues, in most years, school respondents are most likely to report that the number of people using their facilities remains the same. Also similar to revenues, this trend was disrupted by the impact of the COVID pandemic, and the year 2024 shows a return to a more typical pattern. Some 62.3% of school respondents said the number of people using their facilities remained the same from 2023 to 2024. This is up from 2023, when less than half (48%) of school respondents saw no change. Another 31.5% of school respondents said the number of people using their facilities increased in 2024, while just 6.2% reported a decrease. (See Figure 64.)
 The numbers are similar for 2025 and 2026, with 59.8% of school respondents expecting no change to the number of people using their facilities in 2025, and 58.9% expecting no change in 2026. Another 32.3% of school respondents are anticipating increasing numbers of users in 2025, while 7.9% expect a decrease. And 34.7% of school respondents are expecting increasing usage in 2026, with 6.5% anticipating a decrease.
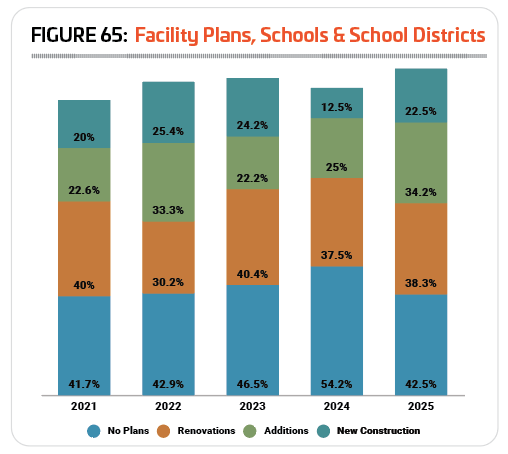
School respondents in 2025 were somewhat more likely than in 2024 to report that they were planning construction at their facilities over the next few years. While 45.8% of school respondents in 2024 had plans for construction, in 2025 that number rises to 57.5%. This compares with 73.3% of non-school respondents in 2025 who are planning construction at their facilities.
School respondents were most likely to be planning renovations to their existing facilities. Some 38.3% of school respondents said they had renovations planned, up slightly from 37.5% in 2024. Another 34.2% of school respondents said they are planning additions to their existing facilities, up from 25% in 2024. And 22.5% of school respondents said they are planning new construction, up from 12.5% in 2024. (See Figure 65.)
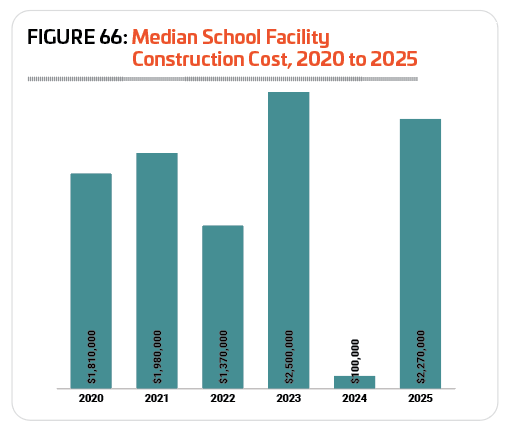
The average budget for school spending on construction in 2025 was a little more than $29.8 million. The median construction cost for schools was $2,270,000 in 2025, an extreme jump from last year’s median cost of just $100,000, but still 9.2% less than the median for 2023 of $2,500,000. (See Figure 66.)
 The most common features found in school respondents’ facilities generally support their youth sports and physical education programs, along with the playgrounds for kids to enjoy during recess time. In 2025, the most common amenities found at school respondents’ facilities were: locker rooms, bleachers and seating, indoor sport courts for sports like basketball and volleyball, concession areas, classrooms and meeting rooms, natural turf sports fields, outdoor running tracks, fitness centers, outdoor sports courts for sports like basketball or tennis, and playgrounds.
Around one-fifth (20.2%) of school respondents in 2025 said they had plans to add features and amenities to their facilities over the next few years, down from 43.3% in 2024, and 38.5% in 2023. This compares with 34.2% of non-school respondents in 2025 who are planning to add features at their facilities.
The 10 most commonly planned features for school respondents in 2025 include:
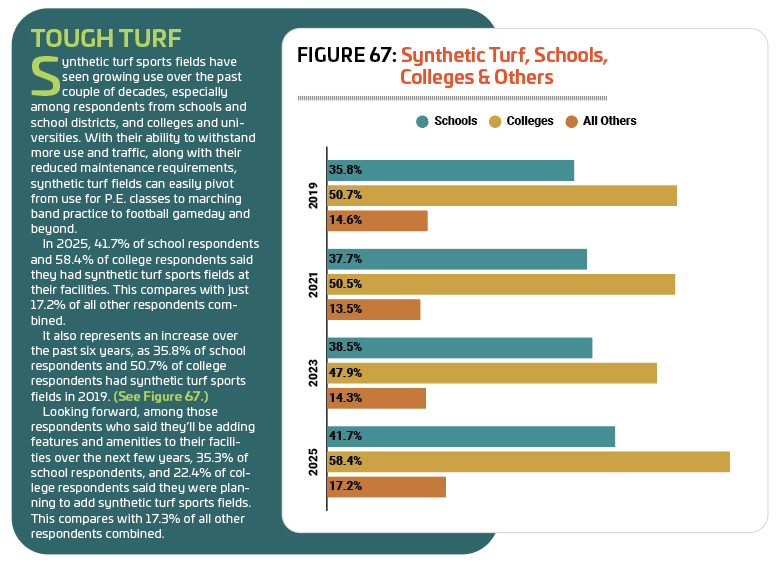
1. Synthetic turf sports fields (35.3% of schools with plans to add features at their facilities are planning to add synthetic turf)
2. Concessions (35.3%)
3. Locker rooms (29.4%)
4. Bleachers and seating (26.5%)
5. Exercise studio rooms (23.5%)
6. Fitness centers (23.5%)
7. Park shelters (20.6%)
8. Classrooms and meeting rooms (20.6%)
9. Indoor sports courts (17.6%)
10. Indoor running tracks (17.6%)
School & School District Programming
The vast majority of school respondents—98.3%—said that they currently offer programming of some kind at their facilities, up from 92.3% in 2024, but more in line with 2023, when 97% offered programming.
Youth sports programs were the most common program offering for school respondents, with 80.2% of school respondents indicating that they currently host youth sports programs. This compares with 49.2% of non-school respondents offering youth sports.
The next most common programs for school respondents in 2025 include: educational programs (69.4% of school respondents said they host educational programming), fitness programs (52.1%), sports tournaments and races (50.4%), individual sports activities like running clubs (43.8%), holiday events and other special events (38.8%), performing arts programs (38%), sport training like golf instruction or tennis lessons (37.2%), day camps and summer camps (35.5%), and teen programming (33.9%).
Respondents from schools and school districts were the least likely in 2025 to be planning to add programs at their facilities over the next few years. Just 12.5% of school respondents were planning to add programming, compared with 26.3% of non-school respondents. This is down from 2024, when 19.2% of school respondents had plans to add programs.
The most commonly planned program additions for school and school district respondents in 2025 include:
1. Fitness programs (no change from 2024)
2. Group exercise programs (no change from 2024)
3. Individual sports activities such as running clubs (not among the top planned programs in 2024)
4. Programs for active older adults (up from No. 8)
5. Sports tournaments and races (up from No. 11)
6. Adult sports teams (no change from 2024)
7. Teen programming (no change from 2024)
8. Functional fitness programs (not among the top planned programs in 2024)
9. Youth sports teams (not among the top planned programs in 2024)
10. Performing arts programs (not among the top planned programs in 2024)
Programs that were among the top planned programs in 2024 that did not make the list in 2025 include aquatic exercise programs, environmental education programs, educational programs, sport training, daycare or preschool programs, adaptive sports programs, and personal training. RM
