


To close out the Industry Report, we’ll take a look at the responses of those who work for YMCAs, YWCAs, JCCs, and Boys & Girls Clubs—generally nonprofit facilities offering a diverse range of programming for a wide range of age groups. This group made up 11.8% of the total respondents in 2025, up from 6.4% in 2024.
Respondents from Ys were most likely to be located in the Northeastern or Midwestern regions of the U.S. Some 31% of Y respondents said they were located in the Northeast, while 28.4% were located in the Midwest. Another 19% said they were from the South Atlantic region. The smallest numbers of Y respondents were found in the South Central (11.2%) and Western (10.3%) regions of the U.S.
 Half of Y respondents (50%) said they were located in suburban communities, up from 32.6% in 2024. Another 31.9% were located in rural areas, down from 44.2%, and 18.1% were located in urban communities, down from 23.3%.
The average population size reached by Y respondents in 2025 was 75,370 people, with a median of 20,450.
Y respondents in 2025 managed an average of 5.3 individual facilities, up from 3.2 in 2024. They were much more likely than other respondents to report that they manage just one individual facility. More than half of Y respondents (50.3%) said they manage just one facility, compared with 35.5% of non-Y respondents. Another 22.8% of Y respondents manage two to three individual facilities, and 10.8% manage four or five individual facilities. The remaining 16.2% manage six or more individual facilities, while 30.8% of non-Y respondents manage at least six individual facilities.
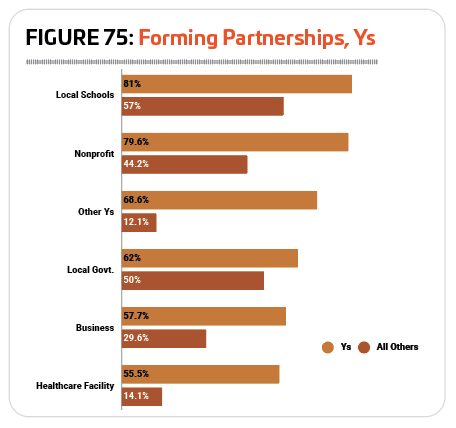
As usual, respondents from Ys were among those most likely to form partnerships with other organizations. In 2025, 98.5% of Ys said they had partnered with outside organizations. This compares with 85.6% of all other respondents, and is up from 96.1% in 2024.
In fact, Ys continued to be more likely to engage with every kind of partner covered by the survey than all other respondents combined. Perhaps the most significant difference is seen in partnerships with other Ys and similar facilities, and with healthcare or medical facilities. More than two-thirds of Y respondents (68.6%) said they partner with other Ys, JCCs, or Boys & Girls Clubs, compared with just 12.1% of non-Y respondents who partner with Ys. And while 55.5% of Y respondents said they had partnered with a healthcare or medical facility, just 14.1% of non-Y respondents had done so. (See Figure 75.)
The other most common partners for Y respondents include local schools (81% of Y respondents had partnered with schools), nonprofit organizations (79.6%), local government (62%), and corporations or local businesses (57.7%).
Ys and similar facilities are well-known for their ability to cater to the whole family, with program opportunities for every age group and often with well-run childcare facilities to boot. Respondents from Ys were much more likely than others to report that they reach all ages, with 63.5% indicating their primary audience is made up of, well, everyone. That compares with 41.5% of non-Y respondents.
When it comes to specific age ranges, Y respondents were most likely to report that they primarily reach children, with 18.2% naming kids ages 4 to 12 as their primary audience. Another 12.4% primarily reach adults. Much smaller numbers said their primary audience is made up of infants and toddlers (2.2%), seniors (2.2%), or teens (1.5%).
Y Facility Budgets & Costs
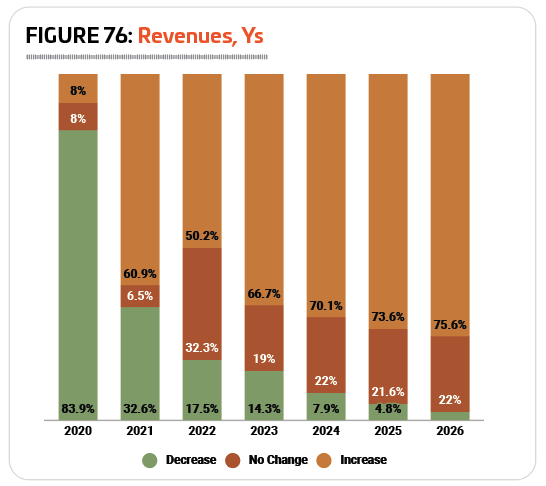 The picture of the years since 2020 show ongoing improvement in revenues for respondents from Ys and similar facilities. Following the dramatic impact of the pandemic—with 83.9% of Y respondents reporting a decrease in revenue in 2020—Ys have gradually seen revenues more and more likely to increase year-over-year. More than seven in 10 (70.1%) Y respondents said their revenues were higher in 2024 than in 2023, with 22% reporting no change, and 7.9% reporting a decrease. (See Figure 76.)
Y respondents expect this trend to continue, with 73.6% anticipating higher revenues in 2025 than in 2024, and 75.6% expecting higher revenues in 2026 than in 2025. In that same time frame, the number of Y respondents expecting revenues to fall drops from 7.9% who reported a decrease in 2024 to 4.8% for 2025, and just 2.4% for 2026.
Y respondents’ average operating budget for 2024 was 1.4% lower than the average reported in 2023. Y respondents spent an average of $5,290,000 on their operating budgets in 2024, down from $5,363,000 in 2023. The median expenditure for Y respondents in 2024 was $1,920,000.
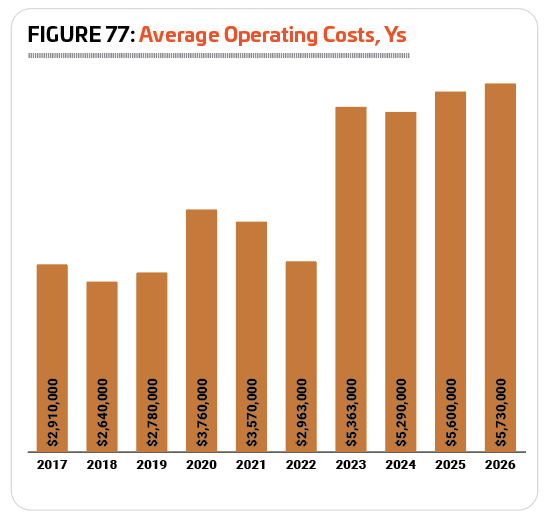 Looking forward, Y respondents are expecting their average operating costs to increase 5.9% in 2025, to an average of $5,600,000. They projected a further increase of 2.3% in 2026, to an average operating cost of $5,730,000. (See Figure 77.)
On average, Y respondents earn back 69.8% of their operating costs via revenues, down from 72.8% in 2024. Just 9.6% of Y respondents said they earn back 30% or less of their costs via revenues, compared with 30.3% of non-Y respondents. On the other hand, more than half (53.5%) of Y respondents said they earn back more than 70% of their costs via revenues, compared with 30.2% of non-Y respondents.
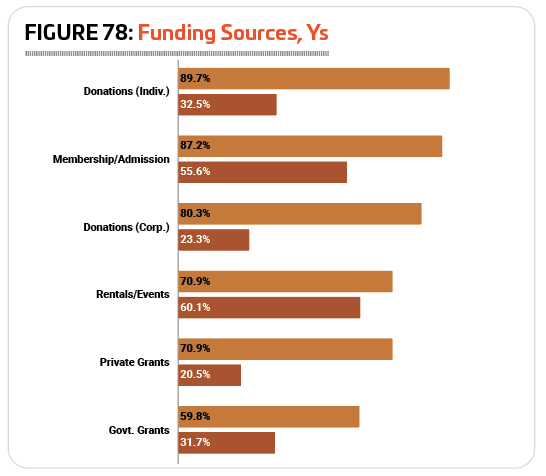
Ys make great use of a network of potential sources of funding, from private grants and donations to admission fees, facility rentals, and more. The most common source of funding for Y respondents in 2025 was private donations from individuals, with 89.7% of Y respondents indicating they received funding for their facilities this way. This compares with just 32.5% of non-Y respondents. More than half of Y respondents said they also received funding from: membership and admission fees (87.2%, compared with 55.6% of non-Y respondents), corporate donations (80.3% vs. 23.3%), fees from facility rentals and private events (70.9% vs. 60.1%), private grants (70.9% vs. 20.5%), and government grants (59.8% vs. 31.7%). (See Figure 78.)
 Y respondents were among the most likely to report that they had taken action over the past few years to reduce their operating costs. Some 89.1% of Y respondents said they had done so, compared with 77.7% of non-Y respondents. This is up slightly from 2024, when 88.1% of Y respondents took action to reduce their expenses.
The most common measures taken by Y respondents to reduce their operating expenses included: increasing their fees (76.5% of Y respondents in 2025 had increased fees, up from 61.9% in 2024; just 48.1% of non-Y respondents in 2025 said they had increased fees); reduced staff (42.9%, up from 33.3%, and compared with just 24.2% of non-Y respondents); improving energy efficiency (42%, down from 47.6%, and compared with 32.7% of non-Y respondents); putting construction or renovation plans on hold (31.1%, down from 40.5%, and compared with 26.8% of non-Y respondents); and cutting programs or services (30.9%, virtually unchanged from 31%, and compared with just 15.9% of non-Y respondents).
Y Facility Use & Construction Plans
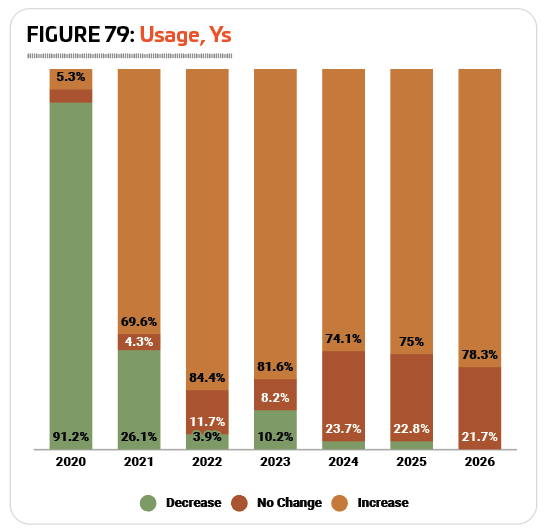 As with revenues, Ys have largely recovered their footing in terms of memberships and facility usage in the wake of the pandemic. COVID had a dramatic impact on all in-person venues, and 91.2% of Y respondents reported a decrease in usage during the shutdowns of 2020, but they had largely recovered by 2022.
In 2024, nearly three-quarters (74.1%) of Y respondents said the number of people using their facilities increased from 2023, while 23.7% reported no change. Just 2.2% reported a decrease in visitors in 2024. (See Figure 79.)
These numbers hold fairly steady in 2025, with 75% of Y respondents expecting the number of people using their facilities to be higher in 2025, and 78.3% expecting higher numbers in 2026. Another 22.8% expect no change in 2025, while 2.2% expect a decrease. And in 2026, 21.7% of Y respondents expect no change to the number of people using their facilities, and none are anticipating a decrease.
Respondents from Ys in 2025 were more likely than at any point in the past five years’ worth of surveys to indicate that they are planning construction at their facilities over the next few years. Some 79.1% of Y respondents in 2025 have such plans, up from 78.7% in 2024, and 67.1% in 2023. This compares with 70.6% of non-Y respondents in 2025 who have plans for construction.
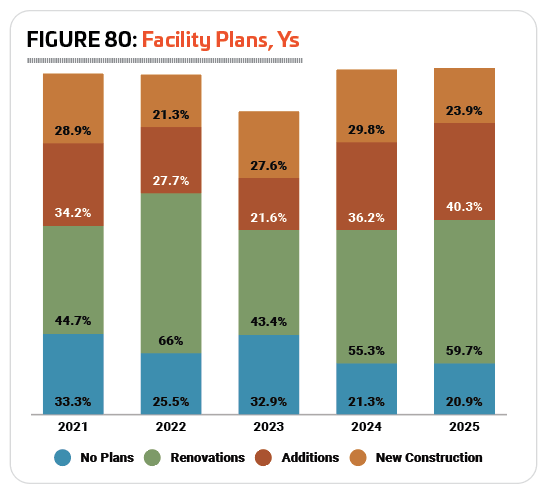 Y respondents were most likely to be planning renovations to their existing facilities. Some 59.7% of Y respondents in 2025 said they were planning renovations, up from 55.3% in 2024. Another 40.3% of Y respondents were planning additions to their facilities, and 23.9% were planning new construction. (See Figure 80.)
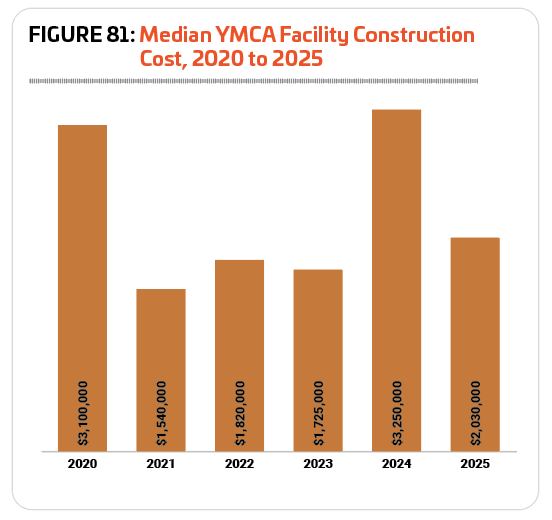
The average budget for Y construction in 2025 was $8,260,000. The median construction cost for Y respondents was $2,030,000, 37.5% less than in 2024, when the median cost was $3,250,000. This represents a 31.8% increase in median construction cost since 2021, when the median was $1,540,000, but is lower than the median in 2020 of $3,100,000. (See Figure 81.)
The 10 most common features or amenities found in Y respondents’ facilities in 2025 include: fitness centers, exercise studio rooms, indoor courts for sports like basketball and volleyball, locker rooms, playgrounds, childcare centers, indoor aquatic facilities, classrooms and meeting rooms, Wi-Fi services, and bleachers and seating.
Respondents from Ys were just about as likely as all other respondents combined to report that they had plans to add features and amenities at their facilities over the next few years. Nearly one-third (32.5%) of Y respondents in 2025 had such plans, compared with 32.6% of all other respondents. This is down from 2024, when 45.9% of Y respondents had plans to add features at their facilities.
The most commonly planned additions for Y respondents in 2025 were:
1. Splash play areas (40% of Y respondents with plans to add features were planning to add splash play)
2. Synthetic turf sports fields (20%)
3. Playgrounds (20%)
4. Indoor sports courts (18.2%)
5. Childcare centers (16.4%)
6. Outdoor sports courts (12.7%)
7. Bleachers and seating (12.7%)
8. Community gardens (12.7%)
9. Outdoor aquatic facilities (12.7%)
10. Locker rooms (10.6%)
Y Facility Programming
 As always, 100% of Y respondents said that they provide programming of some kind at their facilities. This compares with 96.5% of non-Y respondents.
The programs most commonly offered at Y respondents’ facilities in 2025 include: holiday events and other special events (provided by 90.3% of Y respondents); day camps and summer camps (89.6%); group exercise programs (83.6%); fitness programs (82.1%); educational programs (79.1%); mind-body balance programs such as yoga, Pilates, and tai chi (79.1%); programs for active older adults (77.6%); daycare or preschool programs (77.6%); youth sports teams (75.4%); swimming programs (74.6%); and personal training (74.6%).
Showing just how diverse the typical Y program lineup is, more than half of Y respondents also offer teen programming (73.9%), functional fitness programs (73.1%), aquatic exercise programs (70.9%), arts and crafts programs (64.2%), individual sports activities like running or swim clubs (56.7%), and special needs programs (54.5%).
Around one-third (33.1%) of Y respondents in 2025 indicated that they had plans to add programming options to their facilities’ lineup over the next few years. This compares with just 23.6% of non-Y respondents, and is down significantly from 2024, when 62.5% of Y respondents were planning to expand their program lineup.
The most commonly planned program additions for Ys in 2025 were:
1. Adult sports teams (up from No. 3 in 2024)
2. Teen programming (did not appear in this list in 2024)
3. Sport training, such as golf instruction or tennis lessons (down from No. 1)
4. Individual sports activities like running or swim clubs (did not appear in 2024)
5. Special needs programs (up from No. 7)
6. Youth sports teams (up from No. 9)
7. Arts and crafts programs (down from No. 4)
8. Adaptive sports programs (did not appear in 2024)
9. Performing arts programs (up from No. 10)
10. Fitness programs (down from No. 5)
2025’s survey saw three additions to the list of most commonly planned program additions: teen programming, individual sports activities, and adaptive sports programs. These replace nutrition and diet counseling, environmental education programs, and trips from the list in 2024.
Industry Challenges
Ys were once more among those most likely to name staffing as a top concern for their facilities, though fewer found this to be a top challenge in 2025 than in 2024. Some 58.6% of Y respondents said staffing issues were a top concern for their facilities in 2025, down from 76.2% in 2024. This compares with 51.7% of non-Y respondents in 2025 who said staffing was a top challenge for their facilities.
The next most commonly cited challenges for Y respondents’ facilities in 2025 were: equipment and facility maintenance (55%), safety and risk management (40.5%), marketing and increasing participation at their facilities (35.1%), and creating new and innovative programming (31.5%). RM
