


 From neighborhood and HOA swimming pools to community aquatic parks, high school and YMCA natatoriums, private waterparks and beyond, the world of aquatic facilities offers a diverse array of amenities, facilities and programming. The one thing these facilities all have in common is water—and the fact that they’re all covered here, in our annual Aquatic Trends Report.
In these pages, we’ll give you an overview of the responses from more than 500 aquatic industry professionals who answered the call to tell us more about their facilities, and we’ll occasionally dig a little deeper to examine the responses of specific cohorts within that larger group of respondents, including those from parks, schools, colleges, Ys, camps and rec centers, as well as those whose facilities include only indoor or only outdoor pools.
To start off, let’s examine some of the demographic characteristics of our 534 survey respondents, who reported from all across the U.S.
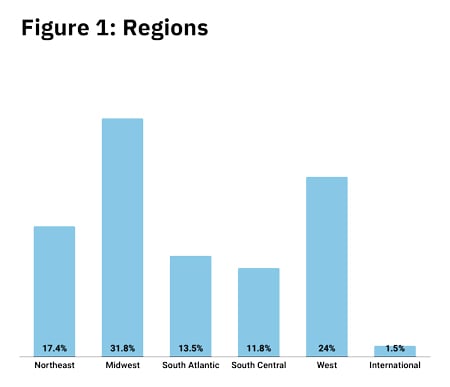
The largest number of respondents—31.8%—were from the Midwest. This includes Illinois, Indiana, Iowa, Kansas, Michigan, Minnesota, Missouri, Nebraska, North Dakota, Ohio, South Dakota and Wisconsin. (See Figure 1.)
 Slightly less than one-quarter of respondents (24%) were from the Western states, including Alaska, Arizona, California, Colorado, Hawaii, Idaho, Montana, Nevada, New Mexico, Oregon, Utah, Washington and Wyoming.
Another 17.4% of respondents were from the Northeast, including Connecticut, Maine, Massachusetts, New Hampshire, New Jersey, New York, Pennsylvania, Rhode Island, and Vermont.
Smaller numbers of respondents reported from southern states, with 13.5% calling the South Atlantic region home. This includes Delaware, Florida, Georgia, Maryland, North Carolina, South Carolina, Virginia, Washington, D.C., and West Virginia.
The smallest number of U.S. respondents—11.8%—reported from the South Central region. This includes Alabama, Arkansas, Kentucky, Louisiana, Mississippi, Oklahoma, Tennessee, and Texas.
Eight respondents (1.5% of the total response) were located outside of the U.S.
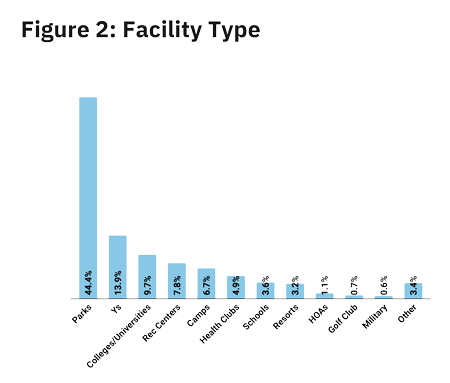
Respondents to the Aquatic Trends survey were by far most likely to be working for parks and recreation departments and districts—44.4% of respondents said they were with parks and rec organizations. They were followed by respondents from YMCAs, YWCAs, JCCs and Boys & Girls Clubs (13.9%). Less than one in 10 respondents said they were with colleges and universities (9.7%); community, private or corporate recreation and sports centers (7.8%); private and youth camps, campgrounds and RV parks (6.7%); health and fitness clubs, racquet clubs or medical fitness facilities (5.2%); schools and school districts (3.6%); resorts and resort hotels (3.2%); homeowners’ associations (1.1%); golf clubs and country clubs (0.7%); or military installations (0.6%). The remaining 3.1% of respondents work for other types of organizations, including waterparks and churches, among others. (See Figure 2.)
 (Where we consider data in terms of the type of organization in the following pages, we’ll be looking at parks, colleges, schools, Ys, camps and rec centers.)
Aquatic facilities come in all shapes and sizes, from small pools managed by HOAs to natatoriums hosting school swim meets to complex outdoor aquatic parks with myriad pools at varying temperatures and depths, along with slides, lazy rivers, splash pads and other amenities. The one thing they all have in common? Water—and not just any water, but water that requires treatment, with chlorine or other disinfecting chemicals, in order to maintain a safe environment for swimming, splashing and more.
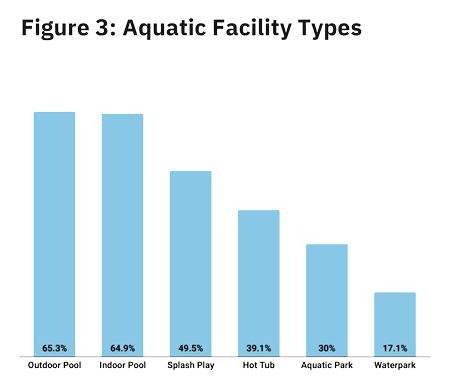
For the purposes of the Aquatic Trends survey, we break down aquatic facilities into a few different types, and asked respondents about the types of facilities they managed. (See Figure 3.)
The types include:
- Outdoor swimming pools
- Indoor swimming pools
- Splash play areas
- Hot tubs, spas and whirlpools
- Aquatic parks (often managed by municipalities, and featuring swimming pools, but also including additional aquatic attractions like slides and lazy rivers)
- Waterparks (more often privately run, with a primary focus on waterslides and rides)
 Outdoor and indoor swimming pools were the most common type of aquatic facility, with nearly two-thirds of respondents indicating they had outdoor swimming pools (65.3%) or indoor swimming pools (64.9%). Some 10.9% of respondents had at least four outdoor swimming pools, and 16.7% of respondents said they only had outdoor swimming pools. (In other words, they had no other aquatic facilities.) Fewer respondents (6.6%) had at least four indoor swimming pools, and 16.3% said they only had indoor pools.
Splash play areas were the next most common type of aquatic facility, with nearly half of respondents (49.5%) indicating they had at least one splash play area, up from 43.3% in 2025’s report. Some 6.6% of respondents said they had at least four different splash play areas, and 3.9% said they only had splash play areas and no other aquatic facilities.
Nearly four in 10 (39.1%) respondents said they had at least one hot tub, spa or whirlpool, up from 28.4% in 2025.
Aquatic parks and waterparks continued to be somewhat less common, though both are more common in 2026’s report than in 2025. Some 30% of respondents this year said they currently have at least one aquatic park, up from 23.5% in 2025; and 17.1% said they currently have at least one waterpark, up from 13.3% in 2025.
Respondents from camps and parks were by far the most likely to indicate that they had at least one outdoor pool. More than three-quarters of respondents from camps (79.4%) and from parks (77.8%) had at least one outdoor pool. They were followed by rec centers, where 69.4% of respondents had at least one outdoor pool. As one might expect, given the nature of their facilities, respondents from Ys (43.5%), colleges (40%) and schools (26.7%) were the least likely to have outdoor swimming pools.
 And indeed, these were the respondents most likely to have indoor swimming pools. Some 95.9% of Y respondents indicated that they have at least one indoor pool, making them the most likely to host indoor aquatics. They were followed by respondents from schools (89.5%) and colleges (86%). Nearly two-thirds (65.7%) of rec center respondents also had indoor swimming pools, as well as slightly over half (50.8%) of park respondents. Not at all surprisingly, camp respondents were least likely to host indoor aquatics, though 22.2% indicated that they had at least one indoor pool.
Parks are by far the most likely to be home to splash play areas. Nearly three-quarters of park respondents (73.3%) said that they currently have at least one splash play area. This is up significantly from the 2025 (67.3%) and 2024 (68.1%) reports. Though they were far less likely than parks to have splash play areas, some 41.9% of Y respondents and 32.3% of rec center respondents said they included splash play at their facilities. Respondents from schools (15.8%), camps (11.5%) and colleges (5.4%) were the least likely to have splash play areas among their aquatic amenities.
Colleges and Ys were the most likely to have hot tubs, spas and whirlpools at their facilities. Some 59.1% of college respondents and 57.1% of Y respondents indicated that they had at least one hot tub. They were followed by rec centers, where 45.2% of respondents have a hot tub. Respondents from parks (25.6%) and camps (7.8%) were much less likely to have a hot tub at their facilities, and no school respondents reported having a hot tub.
 The less common aquatic types—aquatic parks and waterparks—were most likely to be found among park respondents’ facilities. Some 47% of park respondents said they currently have an aquatic park, while 23.8% have a waterpark.
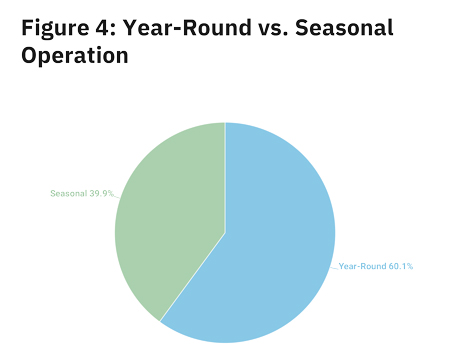
Around six in 10 respondents (60.1%) said their aquatic facilities are open year-round, while 39.9% reported that their facilities operate seasonally. (See Figure 4.)
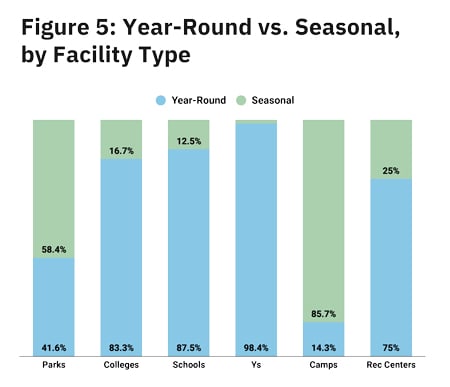
As with indoor vs. outdoor facilities, respondents from colleges, schools and Ys were the most likely to have aquatic facilities that are open year-round, while camps and parks were more likely to have seasonal operations. (See Figure 5.)
The vast majority of respondents from Ys (98.4%) said their aquatic facilities are open year-round, while 87.5% of schools and 83.3% of colleges have year-round operations. Slightly fewer respondents from rec centers (75%) have year-round aquatic operations. On the other hand, 85.7% of camp respondents said that their aquatic operations are seasonal. Parks were also more likely than not to have seasonal aquatic operations, with 58.4% of park respondents indicating that their aquatic operations are seasonal.
Facilities that operate seasonally tend to follow the expected pattern of opening for the summer season, with just a handful of exceptions. Some 58% of respondents with seasonal operations said their facilities open for the season in May, with another 27.8% opening in June. Another 13% said that their aquatic facilities open for the season in March or April. And just two respondents, one from a college and one from a school, said that they open in August or September, with a seasonal operation that runs during the school year, rather than the summer months.
 Similarly, seasonal operations for respondents most typically end when summer does, with nearly half (48.5%) indicating that their facilities close for the season in September, and another 34.5% closing in August. Some 8.2% of seasonal operations are lucky enough to extend their season into October. The remainder indicated a close to their season in other months of the year, including November and December, and May and July for our college and school respondents’ whose facilities run during the school year.
Costs & Construction
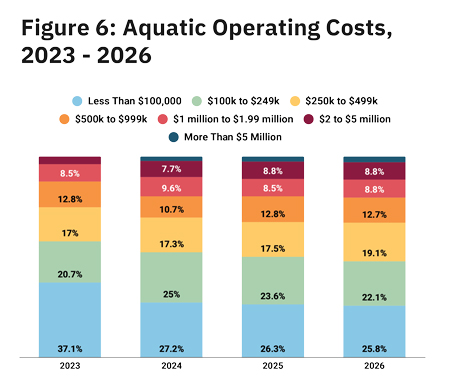
The average (mean) operating cost for aquatic facilities in 2024 was $950,000, but that said, a majority of aquatic respondents spent less than $500,000 on their annual operating costs for 2024. However, the share of respondents who spend less than $500,000 on their annual operating costs has fallen over time, from 74.8% in 2023 to 67% in 2026. (See Figure 6.)
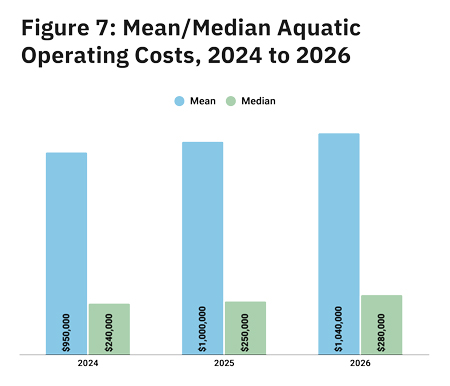
Looking at the years covered by this year’s survey—2024, 2025 and 2026—the average, or mean, operating cost for aquatics is projected to increase by 9.5% from 2024 to 2026, from an average of $950,000 to $1,040,000.
Given that most respondents actually spend far less on their operating costs, it’s also helpful to consider the median operating cost. (Remember, the median number is the number that falls in the exact middle of a set of data that is ordered from lowest to highest.) Considering the median aquatic operating cost, a 16.7% increase is projected from 2024 to 2026, from $240,000 to $280,000. (See Figure 7.)
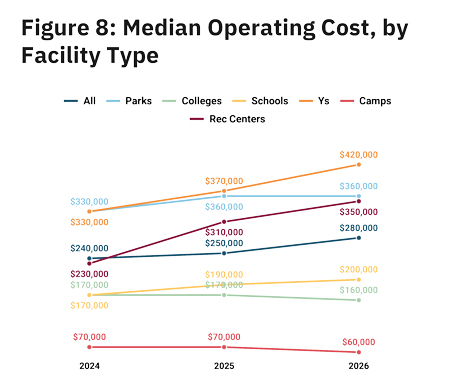 Respondents from rec centers are expecting the steepest increase in their median operating expenditure over this time frame. Rec center respondents projected a 52.2% increase to median operating cost, from $230,000 in 2024 to $350,000 in 2026. Respondents from Ys and schools are also expecting their median operating expense to climb at a faster rate than the average for all respondents. Y respondents projected a 27.3% increase, from $330,000 in 2024 to $420,000 in 2026; and school respondents projected a 17.6% increase, from $170,000 to $200,000.
Park respondents are also expecting their median operating cost to increase, though at a slower clip. These respondents projected a 9.1% increase to median operating expense, from $330,000 in 2024 to $360,000 in 2026.
The median operating expenditure for colleges and camps, on the other hand, is projected to decrease. College respondents projected a 5.9% decline in their median operating expenditure, from $170,000 in 2024 to $160,000 in 2026, while camp respondents projected a 14.3% decrease, from $70,000 to $60,000 over that same time period. (See Figure 8.)
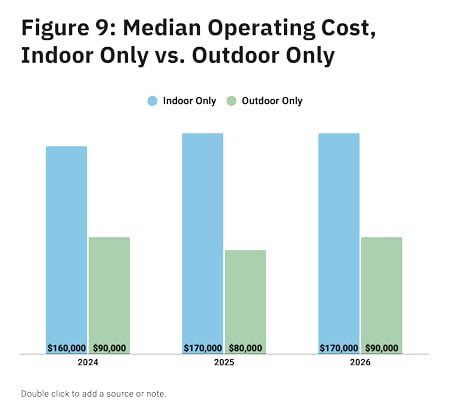
It can also be helpful to compare operating costs for different types of aquatic operations. When we pull out the data for respondents who have only outdoor pools or only indoor pools, one can see a stark difference in their average costs. In 2024, respondents with indoor pools only had a median operating cost that was 77.8% higher than that for those with outdoor pools only, $160,000 vs. $90,000.
Looking forward, respondents with indoor pools only projected that their median operating cost would increase 6.3%, to $170,000 in 2026, while those with outdoor pools only, expected a dip of 11.1% in 2025 (from $90,000 to $80,000), followed by an increase back to $90,000 in 2026. (See Figure 9.)
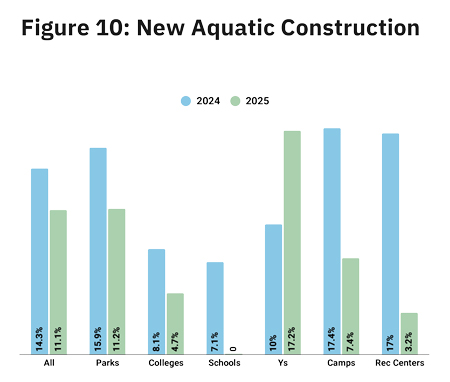
 For the most part, respondents to this year’s survey (2025) were less likely to report that they had built a new aquatic facility. Some 11.1% of all respondents in 2025 said they had built a new aquatic facility, down from 14.3% in 2024. (See Figure 10.)
The only respondents who were more likely to report in 2025 than in 2024 that they had built a new aquatic facility were respondents from Ys. Some 17.2% of Y respondents in 2025 said they had built a new facility, up from 10% in 2024. This also makes them the most likely to have built new facilities in this year’s survey. They were followed by park respondents, 11.2% of whom said they had built a new aquatic facility.
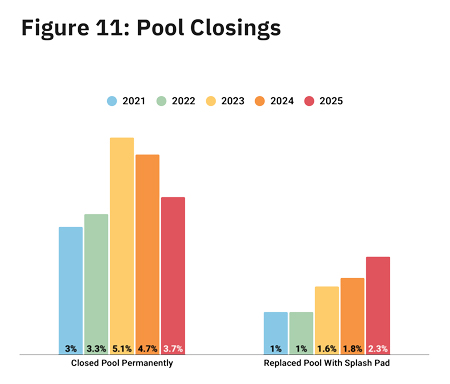
Over the past three years’ surveys, the number of respondents who have permanently closed a swimming pool without building a replacement has fallen slightly, while the number of respondents who have replaced a swimming pool with a splash pad has increased slightly. In 2023, 5.1% of respondents said they had permanently closed a pool over the past few years, while 1.6% had replaced a pool with a splash pad. In 2025, 3.7% of respondents said they had permanently closed a pool, while 2.3% had replaced a pool with a splash pad. (See Figure 11.)
Respondents from parks and colleges were the most likely to report that they had permanently closed a swimming pool without building a replacement. Some 5.6% of park respondents and 4.7% of college respondents said they had permanently closed a pool without building a replacement. They were followed by camps (3.7%) and Ys (1.6%). No school or rec center respondents had closed a pool without building a replacement.
 Only park, rec center and Y respondents said that they had replaced a swimming pool with a splash pad over the past few years. Some 3.6% of park respondents, 3.2% of rec center respondents and 1.6% of Y respondents said they had replaced a pool with a splash pad over the past few years.
Water Treatment & Pool Resources
One thing almost every aquatic facility has in common is a system for keeping water clear and free from the viruses and bacteria that can cause recreational water illness. This includes everything from pool filtration and chlorination systems to secondary disinfection systems, pool automation and more. While our annual State of the Industry Report (published every June) covers higher-level information about aquatic facilities, for this Aquatic Trends Report we go a little deeper, asking respondents to tell us what types of systems and tools they use at their facilities to manage pool water and its chemistry, as well as whether they seek to conserve any of these resources.
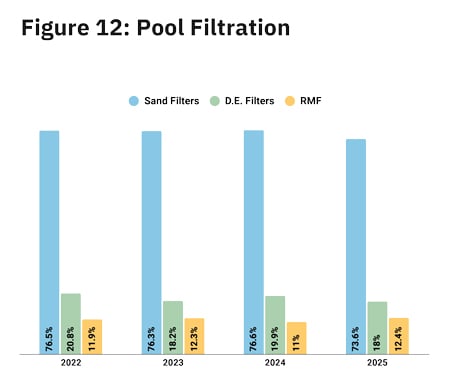
Sand filtration has long been dominant in the swimming pool industry, with smaller numbers of pools relying on D.E. (diatomaceous earth) filters or RMF (regenerative media filters). As you can see, the numbers of respondents to the Aquatic Trends survey using each type of filtration has remained relatively constant over the past four surveys. In 2025, nearly three-quarters of respondents (73.6%) said they use sand filters, while 18% use D.E. filtration and 12.4% rely on RMFs. (See Figure 12.)
 When it comes to disinfecting pool water, chlorination systems are, as always, the dominant disinfection method for aquatic facilities. In 2025, 80% of respondents said that they currently have chlorination systems at their facilities. Another 10.7% said they rely on bromination systems. Looking at the types of chlorination systems respondents use, tablet chlorination is used by 39.6% of respondents, down from 43.3% in 2024, but in line with 2023, when 39.4% of respondents used tablet chlorination systems. Another 6.4% of respondents said they are using salt chlorine generators, down from 8.9% in 2024 and 7.9% in 2023.
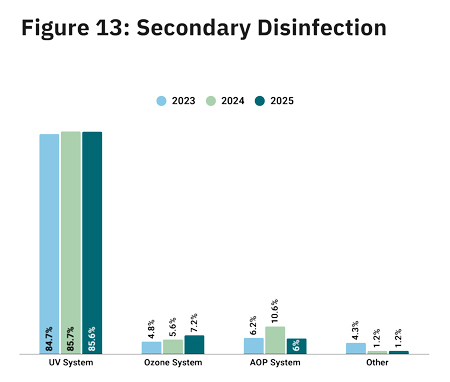
Secondary disinfection systems are strongly recommended for aquatic facilities, including by the Model Aquatic Health Code (MAHC), the set of standards established by the Centers for Disease Control and Prevention (CDC) with the help of industry professionals and aquatics experts. UV, AOP (advanced oxidation process) and ozone systems can provide additional protection beyond the pool’s chlorination system, especially to disable and prevent illnesses that can be caused by chlorine-resistant pathogens like Cryptosporidium. In 2025, 38.2% of respondents said that they’re currently using secondary disinfection systems, down from 42.5% in 2024.
As with filtration systems and the dominance of sand filters, secondary disinfection has its dominant system—UV systems. Of those respondents who said they use secondary disinfection systems, the majority—85.6%—said they rely on UV systems as their backup, a number that has changed very little over the past few years. Another 7.2% of respondents who use secondary disinfection systems are using ozone systems, while 6% rely on AOP systems. (See Figure 13.)
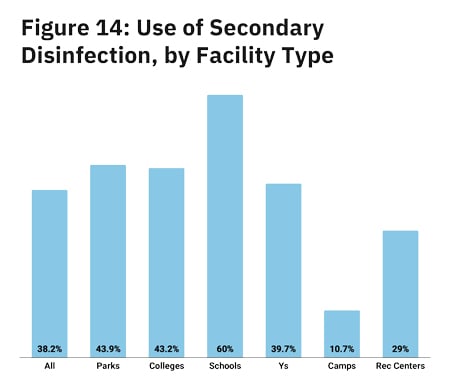
 Respondents from schools were by far the most likely to report that they have secondary disinfection systems in place. Some 60% of school respondents said they do rely on secondary disinfection. They were followed by parks (43.9%), colleges (43.2%) and Ys (39.7%). Camp respondents were the least likely to have secondary disinfection systems in place, with just 10.7% indicating that they do. (See Figure 14.)
In addition to protecting swimmers from chlorine-resistant pathogens, secondary disinfection systems can help address problems with chloramines. Chloramines are a type of combined chlorine that forms in the water and can off-gas into the air, potentially causing skin, eye and respiratory tract irritation for staff and swimmers, as well as contributing to metal corrosion within the facility. Because their complex air handling systems aren’t always well designed for handling chloramines, this problem is more common in indoor aquatic facilities, though pool supply manufacturers have come up with innovative equipment for helping to remove chloramines from the air above the pool’s water, as well as in pump rooms and other potential problem areas. Since secondary disinfection systems can also help address this problem, it comes as no surprise that respondents who only have indoor pools were much more likely than those with outdoor-only facilities to rely on secondary disinfection systems—37.3% vs. 12.1%.
Looking forward, 11.2% of respondents said they had plans to add new systems or update the existing systems at their aquatic facilities over the next three years. This is down from 18% in 2024 and 16.5% in 2023. Respondents from parks (13.9%), rec centers (12.5%) and Ys (12.2%) were the most likely to have such plans, with less than one in 10 respondents from colleges (5.8%), camps (5.6%) or schools (5.3%) indicating that they had plans to update these systems.
 The most commonly planned upgrade to pool water treatment systems was again UV, with one-third (33.3%) of those with plans for any kind of upgrade indicating that they would add UV systems. This is down from 2024, when 46.3% of respondents with plans for upgrades said they would be adding UV systems. Variable speed pumps and solar pool heating were the next most commonly planned addition in 2025, with 31.7% of respondents with plans for any upgrades indicating they’d add them. More than one-fifth of these respondents (21.7%) also said they had plans to add regenerative media filtration systems to their facilities.
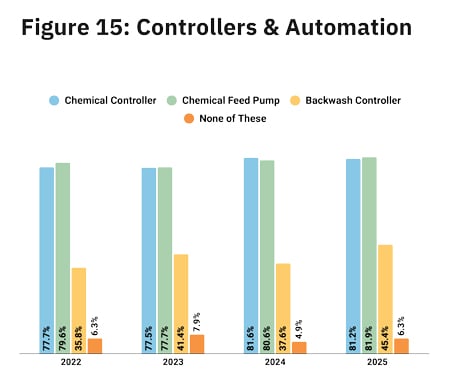
As technology has been developed to handle many parts of recreation, sports and fitness facility components, aquatics is no exception, with an array of options for automating pool systems, helping maintain water balance and providing alerts to aquatic facility managers when that balance is disrupted. Some 93.7% of respondents in 2025 said they use some type of pool automation system, virtually unchanged from last year’s report when 95.1% of respondents had a pool automation system. Again, the types of automation systems respondents rely on has changed little over the past four years, with chemical controllers (81.2%) and chemical feed pumps (81.9%) being the most common. The number of respondents who said they use backwash controllers did see some growth from 37.6% in 2024 to 45.4% in 2025. (See Figure 15.)
 Respondents were much more likely to report in 2025 than in 2024 that they have deployed strategies and tools to conserve resources at their facilities. Nearly two-thirds (65.4%) of 2025 respondents said they had done so, compared with just 47.3% of respondents in 2024, but this is still below the high reported in 2019 of 71%. Nearly half of respondents in 2025 (47.6%) said they were conserving pool chemicals at their facilities, up significantly from 34.8% in 2024 and 33.3% in 2023, possibly reflecting ongoing challenges around cost and supply of pool chemicals. Another 43.7% of respondents said they have deployed strategies and tools to conserve energy at their facilities, up from 29.1%, and 41% said they aim to conserve water, up from 27.6%.
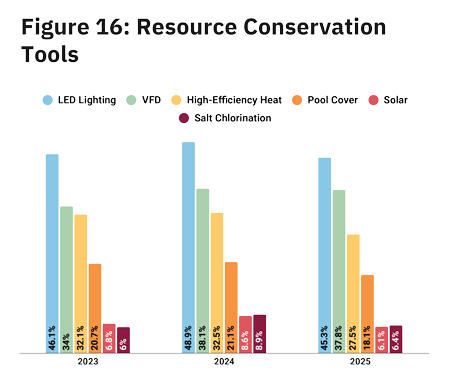
While respondents were much more likely to be aiming to conserve energy, chemicals and water at their facilities, they were somewhat less likely to be relying on some of the specific tools that can help with this task. LED lighting, for example, was used by 45.3% of respondents in 2025, down from 48.9% in 2024. The next most commonly used tool—variable frequency drives (VFDs)—saw virtually no change, with 37.8% of respondents using them in 2025 and 38.1% using them in 2024. High-efficiency heaters (27.5% vs. 32.5%), pool covers (18.1% vs. 21.1%), solar power (6.1% vs. 8.6%) and salt chlorination (6.4% vs. 8.9%) were likewise all less frequently used in 2025 than in 2024. (See Figure 16.)
Components & Amenities
 While all aquatic facilities have water in common, in other respects they can vary tremendously, with some offering swim lessons, others designed for recreation, splashing and sliding, and still others meant for competitive events. And in every case, the planned end use of the pool will determine the components and amenities included in that facility.
But every aquatic facility has a safety component, and so it makes sense that lifeguard stands are the most common item found at respondents’ facilities. A majority—79.7%—of respondents said their facilities include lifeguard stands, down slightly from 82% in 2024. More than half of respondents in 2025 also had lane lines (77.2%), pool lifts or other accessibility equipment (68.2%), or pool exercise equipment (53.9%).
The equipment, components and amenities measured by the survey (and the number of respondents who have them) include:
- Lifeguard Stands (79.7%)
- Lane Lines (77.2%)
- Pool Lifts or Other Accessibility Equipment (68.2%)
- Pool Exercise Equipment (53.9%)
- Starting Platforms (48.2%)
- Pool Slides (46.3%)
- Zero-Depth Entry (46.3%)
- Diving Boards (45.2%)
- Shade Structures (40.8%)
- Water Basketball Equipment (32%)
- Scoreboards (27.2%)
- Pool Inflatables (19.8%)
- Teaching Platforms (19.6%)
- Water Playgrounds (19.1%)
- Water Polo Equipment (19.1%)
- Pool Blankets or Covers (18.1%)
- Lazy Rivers (16.4%)
- Water Volleyball Equipment (14.3%)
- Diving Platforms (12.7%)
- Swim Platforms (12.4%)
- Swim Walls or Pool Bulkheads (11.8%)
- Poolside Cabanas (11.1%)
- Poolside Climbing Walls (6.9%)
- Lily Pads/Water Walks (6%)
- Pool Obstacle/Ninja Courses (6.2%)
- Underwater Treadmills or Bikes (5.1%)
- Wave Pools (2.3%)
- River Raft Rides (2.3%)
- Surf Machines (1.6%)
- Water Coasters (0.9%)
 While there was very little change in the numbers of respondents who had most of these types of equipment, three areas saw growth of at least two percentage points from 2024 to 2025: zero-depth entry (up 3.6 points); pool inflatables (up 2.9); pool exercise equipment (up 2.8); and lazy rivers (up 2.7).
Respondents from parks were more likely than those from other types of facilities to include diving boards, pool slides, zero-depth entry, water playgrounds, shade structures, lazy rivers, poolside cabanas, poolside climbing walls, lily pads or water walks, wave pools, river raft rides and surf machines.
College respondents were more likely than others to include diving platforms, underwater treadmills or bikes, water basketball equipment, water volleyball equipment, swim platforms, and swim walls or pool bulkheads.
School respondents were more likely than others to include starting platforms, scoreboards and water polo equipment.
Y respondents were more likely than others to include lane lines, pool lifts or accessibility equipment, lifeguard stands and teaching platforms.
Finally, respondents from rec centers were more likely than others to include pool inflatables and pool obstacle or ninja courses.
The number of respondents who report that they are planning to add features, equipment and components to their facilities over the next three years has dropped by nearly half since 2023. In 2025, 21.3% of respondents said they had such plans, down from 36.8% in 2024 and 41.8% in 2023.
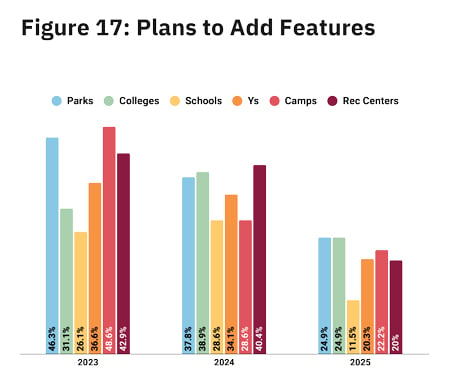 Respondents from parks and colleges were the most likely to be planning to add features to their facilities. Nearly one-quarter (24.9%) of respondents from parks and from colleges said they had such plans. They were followed by camps (22%), Ys (20.3%) and rec centers (20%). School respondents (11.5%) were the least likely to be planning to add features at their facilities over the next three years. (See Figure 17.)
The 10 most commonly planned additions at aquatic facilities in 2025 include:
1. Shade structures (planned by 22.8% of those who will be adding features, down from 27% in 2024).
2. Poolside climbing walls (16.7%, down from 20.4%)
3. Water volleyball equipment
(16.7%, up from 13.1%)
4. Pool slides (15.8%, down from 21.2%)
5. Underwater treadmill or bike
(15.8%, up from 13.9%)
6. Poolside cabanas (14.9%, down from 20.4%)
7. Water basketball equipment (14%, down from 16.1%)
8. Pool exercise equipment (13.2%, down from 14.6%)
9. Pool inflatables (12.3%, down from 15.3%)
10. Teaching platforms (12.3%, down from 17.5%)
Aquatic Programming
 Formal programming isn’t necessarily offered at every aquatic facility, but the vast majority of respondents to the survey—94.7%—said that they do currently host programming of some kind at their facilities. This number has been consistent through most years of the survey, with 96% offering programming in 2024, 96.9% in 2023 and 97.5% in 2022.
A full 100% of respondents from colleges and universities, Ys and rec centers said that they currently host programming at their facilities. They were followed by parks (96.9%) and schools (93.8%). Respondents from camps were the least likely to host programming at their aquatic facilities, though more than three-quarters (77.8%) said that they do.
The most common types of programs continue to be learn-to-swim programs, followed by lifeguard training, leisure swim time, and lap swimming. Here is a list of the programs covered by the survey, and their prevalence among respondents’ offerings:
- Learn-to-Swim Programs (79.9%)
- Lifeguard Training (78.5%)
- Leisure Swim Time (77.5%)
- Lap Swim Time (76.2%)
- Aquatic Aerobics (66.9%)
- Birthday Parties (61.8%)
- Facility Rentals for Events (61.6%)
- Water Safety Training (60.9%)
- Youth Swim Teams (58.1%)
- Swim Meets & Other Competitions (51.9%)
- Programs for Those With Physical Disabilities (38.9%)
- Programs for Those With Developmental Disabilities (38.2%)
- School Swim Teams (36.6%)
- Water Walking (31%)
- Dive-In Movies (26.6%)
- Aqua-Therapy (20.8%)
- Adult Swim Teams (19.7%)
- Aqua-Yoga & Other Balance Programs (18.5%)
- Diving Programs & Teams (15.3%)
- Water Polo (14.6%)
- Doggie Dips (13.7%)
- Collegiate Swim Teams (7.4%)
- Ninja or Obstacle Course Competitions (3%)
 Programs that saw an increase of at least two percentage points from 2024 to 2025 include: aquatic aerobics (up 5.3 percentage points); programs for those with developmental disabilities (up 4.6); programs for those with physical disabilities (up 2.9); ninja competitions (up 2.5); and water safety training (up 2.3).
Long known for their excellence in offering a wide variety of programming for all ages, Ys are by far the most likely to offer the most different types of programming. They were more likely than respondents from other facility types to include learn-to-swim programming, lifeguard training, leisure swim time, lap swimming, aquatic aerobics, birthday parties, water safety training, youth swim teams, programs for those with physical or developmental disabilities, water walking, aqua-therapy, aqua-yoga and other balance programs,
School respondents were more likely than others to host swim meets and other competitions, school swim teams, adult swim teams, diving programs and teams, and water polo.
College respondents were the most likely to include dive-in movies, collegiate swim teams, and ninja or obstacle course competitions.
Finally, park respondents were more likely than others to include doggie dips as part of their programming lineup.
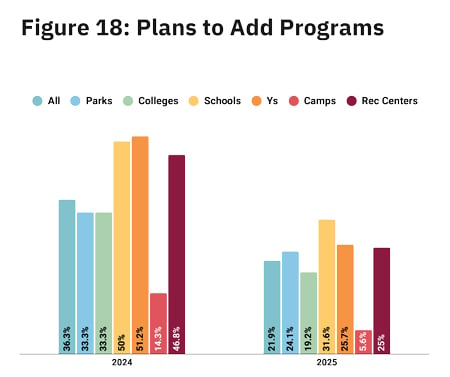
More than one-fifth (21.9%) of respondents in 2025 said that they had plans to add aquatic programs at their facilities over the next three years. This is down significantly from 2024, when 36.3% had such plans, as well as 2023 (33.4%) and 2022 (34.6%).
 Respondents from schools (31.6%), Ys (25.7%) and rec centers (25%) were the most likely to report that they were planning to expand their aquatic programming lineup over the next few years. Respondents from camps were the least likely to have such plans, with just 5.6% indicating that they would be adding aquatic programs at their facilities. (See Figure 18.)
The 10 most commonly planned program additions include:
1. Programs for those with physical disabilities (planned by 32.5% of those who will be adding programs, up from 30.4% in 2024)
2. Programs for those with developmental disabilities (30.8%, up from 28.1%)
3. Dive-in movies (23.1%, down from 29.6%)
4. Aqua-yoga and other balance programs (18.8%, down from 25.9%)
5. Aquatic aerobics (17.9%, down from 27.4%)
6. Adult swim teams (16.2%, up from 13.3%)
7. Learn-to-swim programs (14.5%, up from 12.6%)
8. Aqua-therapy (14.5%, down from 23.7%)
9. Swim meets and other competitions (13.7%, up from 11.1%)
10. Youth swim teams (12.8%, down from 14.8%)
Swimming lessons are a crucial tool in preventing injury and death from drowning, but a research study conducted by the American Red Cross in 2020 found that more than half (56%) of children ages 4 to 17 could not perform the basic water safety skills necessary to save their own lives. According to the American Red Cross, drowning is the top cause of death for children ages 1 to 4, and among children 5 to 14 years old, drowning is the second leading cause of unintentional injury death. For children and adults with autism, drowning is the leading cause of death, and people with autism spectrum disorder are nearly 40 times as likely to die from drowning than the general population.While these are grim statistics, a study published in the Archives of Pediatrics & Adolescent Medicine in 2009 found that participation in formal swimming lessons can reduce the risk of drowning among kids ages 1 to 4 by up to 88%.
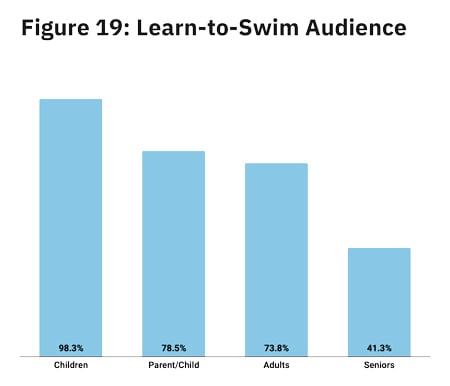
 Given the nature of their facilities, it should be no surprise that the most common type of programming offered at aquatic facilities is learn-to-swim programs. We asked these respondents for more details about the audience they primarily reach with their swim lessons. The vast majority of those respondents—98.3%— who currently provide learn-to-swim programs said that they provide swim lessons for children 17 and younger, up from 97.4% in 2024 and 94.7% in 2023. Another 78.5% provide swim lessons designed for parents or caregivers and their babies or toddlers, up from 67.6% in 2024 and 74.8% in 2023. Nearly three-quarters (73.8%) said they provide swim lessons for adults, up from 64.1% in 2024 and 66.9% in 2023. And 41.3% said they offer swim lessons specifically for seniors, up from 35.6% in 2024 and 39.7% in 2023. (See Figure 19.)
Many people face barriers that prevent them from accessing learn-to-swim or water safety programs, including socioeconomic status, community access (not every community features public swimming pools), and even whether their parents learned to swim or not. (A USA Swimming Foundation/University of Memphis study found that there’s just a 13% chance that a child will learn to swim if their parent doesn’t know how to swim.) Fear of the water can also play a role, with nearly half of American adults afraid of the deep water in swimming pools. To overcome these barriers, many aquatic facilities conduct formal outreach and programs that are specifically intended to reach non-swimmers and those with a fear of water.
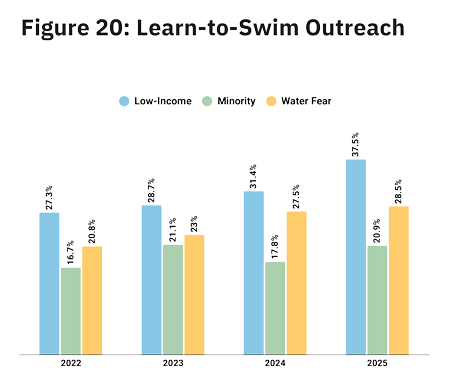
 Over the past few years, the number of respondents with swim lessons who said they are engaged in this type of barrier-busting program has increased for every type of audience covered by the survey. In 2025, 37.5% of swim lesson providers covered by the survey said they were involved in outreach to low-income communities, up from 27.3% in 2022. Another 28.5% of respondents said they were involved in programs designed for those who have a fear of the water, up from 20.8% in 2022. And 20.9% of swim lesson providers in 2025 said they were involved in minority outreach programs, up from 16.7% in 2022. (See Figure 20.)
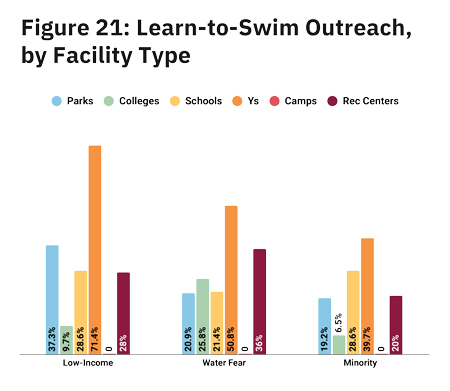
Respondents from Ys were by far the most likely to be involved in every type of learn-to-swim outreach. A full 71.4% of Y respondents with swim lesson programs said they were involved in low-income outreach, while 50.8% had programs for overcoming a fear of water, and 39.7% were involved in minority outreach. (See Figure 21.)
Staffing & Safety
While swim lessons are an important part of ensuring swimmers are safe in the water—whether they’re at your aquatic facility or elsewhere—many facilities also provide water safety training, which can also be carried beyond the pool fence, so to speak. In fact, 60.9% of respondents said they currently host water safety training, up from 58.6% in 2024. And while that training can go a long way toward preventing drowning and other accidents, most facilities rely on the tried-and-true method: a staff of well-trained lifeguards.
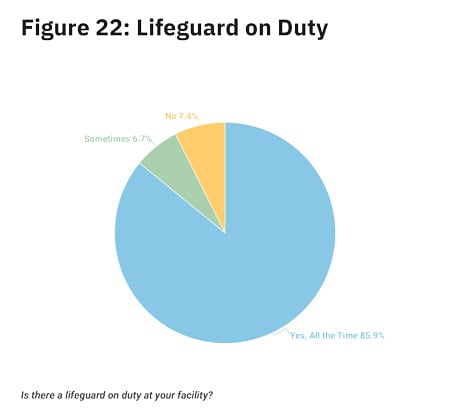
 In fact, more than nine in 10 respondents—92.6%—said that a lifeguard is on duty at least some of the time during their hours of operation, up slightly from 91.6% in 2024. Some 85.9% said that a lifeguard is on duty at all times, up from 82.5%, while 6.7% said a lifeguard is on duty during at least some hours of operation, down from 9.1%. Just 7.4% of respondents said they do not employ lifeguards at their facilities, down from 8.4% in 2024. (See Figure 22.)
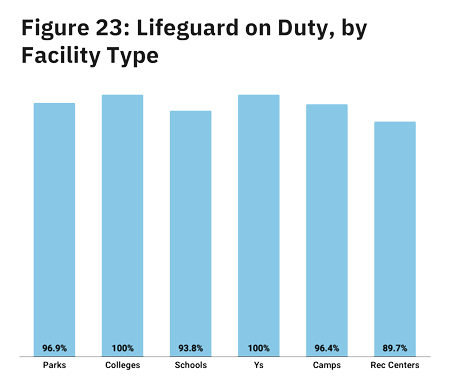
All 100% of respondents from colleges and from Ys said that they have a lifeguard on duty. For Ys, a lifeguard is on duty during all hours of operation, while for colleges 90.7% always have a lifeguard on duty, and 9.3% have a lifeguard on duty during some hours of operation. More than nine out of 10 respondents from parks (96.9%), camps (96.4%) and schools (93.8%) also said they have a lifeguard on duty during at least some hours, with the majority in each group providing a lifeguard during all hours that the facility is open. (See Figure 23.)
Just as UV and other secondary disinfection systems can provide a backup to chlorination systems, there are drowning prevention tools that can provide a backup to your lifeguarding staff. As with chlorination, the primary system (in this case, lifeguards) is the most essential, but other tools can help catch swimmers in trouble who might otherwise slip through the cracks. The tools most often used by respondents to the Aquatic Trends survey to prevent drowning include:
- Lifeguard on duty: 92.6%, up from 91.6% in 2024.
- Life preservers required for less-skilled swimmers: 51.1%, up from 45.9%
- Video or other in-pool system for detecting swimmers in trouble: 5.9%, down from 6.9%
- Other: 4.9%
- None: 5.6%
 Some of the “other” methods for protecting swimmers from drowning and injury include: age limits on who can enter the facility, swim tests before allowing children into the deep end of the pool, direct parental supervision requirements, and equipment that provides submersion alerts.
In the wake of the COVID-19 pandemic, we began to measure how many respondents to the survey were finding it challenging to find and hire lifeguards for their aquatic facilities. For various reasons, the pandemic had a dramatic impact on lifeguard availability, including a dearth of training opportunities and the so-called “great resignation” or “great reshuffling” as workers in all kinds of professions changed jobs and careers. Initially, in 2022, more than two-thirds (67.3%) of respondents to the Aquatic Trends survey said that they were having a hard time finding lifeguards. But that number has gradually fallen in the years since, to 53.3% in 2023, 41.8% in 2024, and now 38% in 2025. While this represents a significant drop, it’s worth noting that well over two-thirds of respondents are still having difficulties when it comes to lifeguard staffing.
As a result of these difficulties, 29.3% of all respondents said that they have reduced their operating hours, 6.3% have shortened their season of operation, and 2.3% said that at least one of their facilities remained closed.
Respondents from Ys and schools were still far more likely to report that lifeguard staffing was a challenge in 2025, with 65.6% of Y respondents and 62.5% of school respondents indicating that they were challenged to staff lifeguards. At the other end of the spectrum were colleges (36.6%), parks (35.6%), camps (33.3%) and rec centers (24.1%).
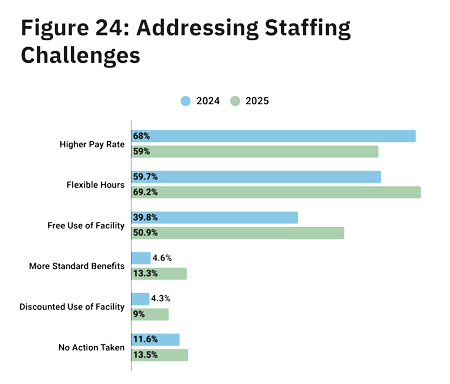
 Regardless of whether they are experiencing challenges with finding lifeguards, we also asked respondents to tell us about some of the measures they use to attract lifeguards and other staff members to their facility. Interestingly, while more than half of respondents in 2025 (59%) had offered a higher pay rate in order to attract staff, this number has fallen over the past few years, from a high of 74.2% in 2023 and 68% in 2024. At the same time, the number of respondents offering flexible hours has risen, from 53.8% in 2022 to 59.7% in 2024 and now to 69.2% in 2025. Also seeing an increase was free use of the facility, which rose from 39.8% in 2024 to 50.9% in 2025. (See Figure 24.)
Lifeguard training and certification is essential to ensure that your staff maintains the knowledge and skills needed to protect swimmers at your facility, but the training and certification that helps provide safety and smooth operations is not limited to lifeguards. Certifications like the Certified Pool & Spa Operator or Aquatic Facility Operator validate the knowledge of staff members responsible for your pool’s water chemistry and testing, mechanical equipment, ventilation requirements and more. Continuing education for these certifications helps these professionals keep their skill set updated.
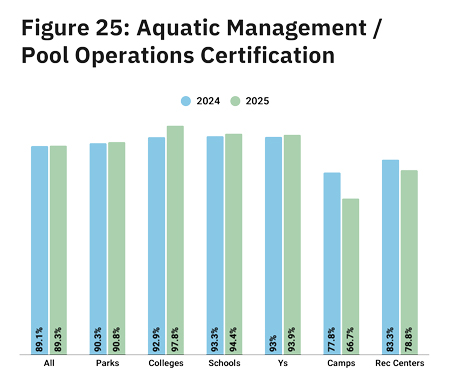
In 2025, 89.3% of respondents said that they or someone at their facility has an aquatic management or pool operations certification, a number that has changed very little over the past few years.
Respondents from colleges were the most likely to require such certification in 2025, with 97.8% indicating that they or someone at their facility hold an aquatic management certification. More than nine out of 10 respondents from schools (94.4%), Ys (93.9%), and parks (90.8%) also have these certifications, while respondents from rec centers (78.8%) and camps (66.7%) were somewhat less likely to have pool operations or aquatic management certifications. (See Figure 25.) RM
