


The number of respondents to the Industry Report survey whose facilities include aquatic elements—swimming pools, waterparks, splash play areas and hot tubs—has remained steady over the past 20 years, averaging 53.7% for all 20 years’ worth of responses, with a low of 45.2% reported in 2023 and a high of 62.5% reported the very next year in 2024. 2026 saw the second highest percentage of respondents reporting that their facilities included aquatics, at 58.4%, well above the 20-year average and up from 52% in 2025.
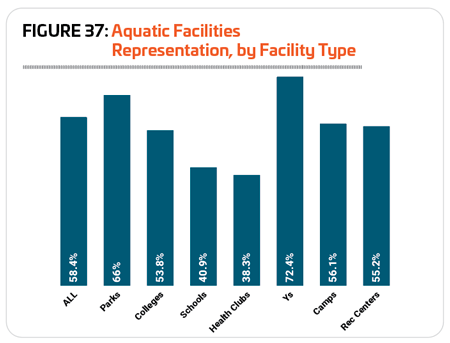 As usual, respondents from Ys were the most likely to include aquatics at their facilities, with 72.4% of Y respondents indicating that their facilities currently include indoor or outdoor pools, splash play, waterparks or hot tubs. They were followed by respondents from parks (66%), camps (56.1%), rec centers (55.2%) and colleges (53.8%). Less than half of respondents from schools (40.9%) and health clubs (38.3%) said that their facilities currently include aquatics. (See Figure 37.)
There is generally some variation in the prevalence of different types of aquatic facilities in any given year, with outdoor pools almost always being the most prevalent, followed by indoor pools, splash play, hot tubs and waterparks. But looking at the data since 2008 (the first year for which we have data for the different aquatic facility types) paints a slightly different picture. Outdoor swimming pools are still the most common type of aquatic facility, but their prevalence has fallen, from an average of 71.3% for 2008-20 to an average of 65.9% for 2021-25. In 2026, 61.4% of aquatic respondents reported that they currently have an outdoor swimming pool. The opposite is true for splash play areas, which have seen their prevalence grow from an average of 46.4% for 2008-20 (and growing in that time from a low of 22.7% in 2008) to 49.7% in 2021-25. In 2026, 55.6% of aquatic respondents said that they currently have at least one splash play area.
Splash play was the only aquatic facility type that was more prevalent in 2021-25 than 2008-20. Indoor pools, hot tubs and waterparks all declined in prevalence in that time period, though respondents in 2026 were more likely to have all three than the average reported for 2021-25. (See Figure 38.)
Considered by region, indoor swimming pools were most common for respondents in the Northeast, while outdoor swimming pools as well as splash play areas were most common in the South Atlantic region.
Some 73.8% of aquatic respondents in the Northeast said they currently have at least one indoor swimming pool. They were followed by respondents in the South Central region (66.7%) and Midwest (63.8%), while respondents in the West (51%) and South Atlantic (42.6%) regions were less likely to have indoor pools.
Outdoor swimming pools were most common for respondents in the South Atlantic region (69%), followed by the West (63.6%) and South Central region (61%). More than half of respondents in the Northeast (57.9%) and Midwest (54%) also said they currently have at least one outdoor pool.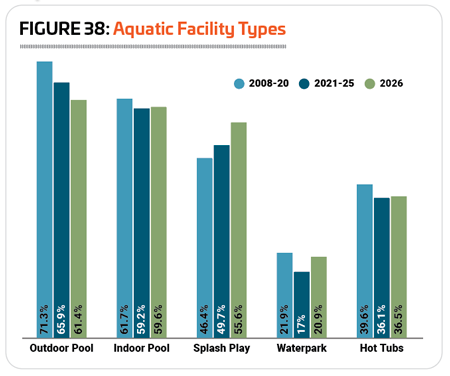
Respondents in the South Atlantic region are nearly as likely to have a splash play area as they are to have an outdoor swimming pool. Two-thirds (66.7%) of South Atlantic respondents said they have at least one splash play area, making them much more likely than respondents in other regions to be home to splash play. That said, at least half of respondents in every other region also have splash play areas, led by those in the Northeast (57.4%), and followed by the Midwest (55.4%) and West (54.9%). Respondents in the South Central region were least likely to have splash play areas, though 50% said that they had at least one.
Hot tubs, spas and whirlpools were most common in the West, where 41.2% of respondents said they currently have at least one hot tub. They were followed by the South Central region (37.1%) and the Midwest (34.9%), while respondents in the Northeast (28%) and South Atlantic (23.4%) regions were less likely to have hot tubs in their facilities.
Respondents in the Midwestern and South Atlantic states were most likely to be home to waterparks. Some 24% of Midwestern aquatic respondents and 23.9% of those in the South Atlantic region said that they currently have at least one waterpark. They were followed by the South Central region, where 18.2% of aquatic respondents currently have a waterpark. Respondents in the West (13.7%) and Northeast (13.3%) were less likely to report that they had any waterparks.
Considered by organization type, respondents from health clubs, Ys, colleges and schools were all more likely than others to have indoor swimming pools, while those from camps and parks were more likely to have outdoor swimming pools.
All 100% of aquatic respondents from health clubs said that they currently have at least one indoor pool. They were followed by Ys (93.3%), colleges (89.6%) and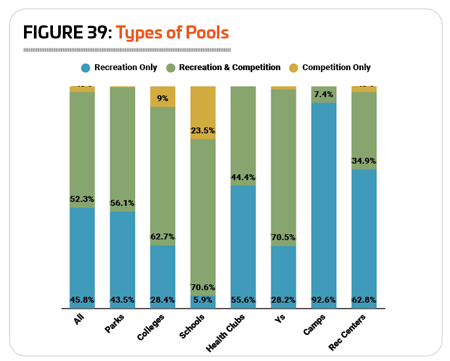 schools (82.4%). A majority of rec center respondents (71.8%) also said they had at least one indoor pool, while parks (41.4%) and camps (11.1%) were much less likely to have indoor swimming pools.
On the other hand, 78.6% of aquatic respondents from camps, and 69.5% from parks said that they currently have at least one outdoor pool. Some 70% of rec center respondents also said they had at least one outdoor pool. Respondents from schools (38.5%), Ys (37.7%), health clubs (36.4%) and colleges (27.3%) were much less likely to have outdoor swimming pools.
Splash play was most common for parks and rec centers. Some 78.1% of aquatic respondents from parks said that they currently have at least one splash play area, while 64.7% of rec center respondents had at least one splash play area. Respondents from health clubs (36.4%), camps (36%) and Ys (29.9%) followed, though distantly, while respondents from schools (9%) and colleges (5.8%) were the least likely to have a splash play area.
Aquatic respondents from health clubs were by far the most likely to indicate that they have at least one hot tub at their facilities. Some 94.1% of health club respondents with aquatics said that they have a hot tub. They were followed, though distantly, by rec centers (47.1%), Ys (46.5%) and colleges (34.5%). Nearly a quarter of park respondents (24.5%) also said they have at least one hot tub, while just 18.2% of school respondents and 14.3% of camp respondents have hot tubs.
Waterparks were most common for respondents from parks (26.7%) and rec centers (26.7%). A handful of respondents from camps and Ys also said that they currently have a waterpark, while only a couple of college and health club respondents said that they have a waterpark, and no school respondents had waterparks.
Over the years, facilities that are used for both recreation and competition, or for recreati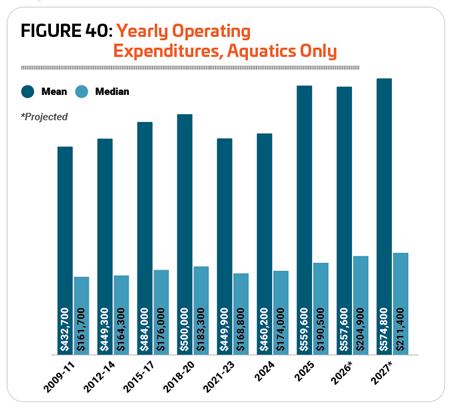 on only, have dominated the pools, splash pads and waterparks covered by the Industry Report. 2026 is no different, with more than half (52.3%) of respondents reporting that their facilities hosted a combination of recreational and competitive activities and most of the rest (45.8%) reporting that their facilities were for recreation only. Just 2.5% of aquatic respondents said their facilities are used for competitive activities only. (See Figure 39.)
Competition-only pools were most likely to be found at college and school respondents’ facilities. Nearly a quarter (23.5%) of school respondents with aquatics said their facilities were used for competition, and about one in 10 (9%) college respondents said the same. Very small numbers of others said they had competition-only aquatic facilities, including rec centers (2.3%), Ys (1.3%) and parks (0.4%). No respondents from health clubs or camps had competition-only aquatic facilities.
Schools and Ys were the most likely to report that their aquatic facilities had both recreational and competitive programming. Some 70.6% of school respondents and 70.5% of Y respondents said their aquatic facilities were used for a combination of both recreation and competition. They were followed by colleges (62.7%), parks (56.1%) and health clubs (44.4%). More than one-third of rec centers (34.9%) said that they used their aquatic facilities for both recreation and competition, and just 7.4% of camps said the same.
Camp aquatic facilities were overwhelmingly used for recreation only, with 92.6% of camp respondents indicating that this was the case. More than half of respondents from rec centers (62.8%) and health clubs (55.6%) also said that their aquatic facilities serve recreational purposes only. Fewer respondents from parks (43.5%), colleges (28.4%) and Ys (28.2%) had recreation-only pools. School respondents (5.9%) were the least likely to report that their pools were used for recreation only.
Aquatic Costs & Revenues
In the decade between 2010 and 2020, operating costs for aquatics increased at a steady clip, with the mean as well as the median rising at similar rates. The mean was up 15.6%, from $432,700 in 2009-11 to $500,000 in 2018-20, while the median rose 13.6% in that same time frame, from $161,700 to $183,300. Following this, there was a dip in 2021-23, with the mean falling 10% from $500,000 2018-20 to $449,000, and the median falling 7.9% to $168,800. (See Figure 40.)
This was followed by a slight increase in 2024, while 2024 to 2025 recorded a much bigger increase. The mean aquatic operational expenditure rose 2.3% from 2021-23 to 2024, from $449,900 to $460,200, and rose again by 21.6% to $559,600 in 2025. At the same time, the median increased 3.1% from 2021-23 to 2024, from $168,800 to $174,000, and rose again by 9.5% to $190,500 in 2025. It should be noted that when the mean increases at a faster clip than the median, it is usually because there’s an increase in the amounts being spent by the highest outliers. In other words, the most expensive aquatic facilities saw their costs go up at a faster clip than most respondents.
Looking forward, that trend flips, with the median projected to increase at a faster clip than the median from 2025 to 2027. The median operating expenditure is expected to increase by 11% from $190,500 in 2025 to $211,400 in 2027, while the mean is expected to increase by just 2.7% in that same time frame, from $559,600 to $574,800.
Considered by facility type, while Ys reported the highest overall operating costs for their aquatic operations in both 2024 and 2025, respondents from rec centers saw their costs increase at the fastest rate from 2024 to 2025. Rec center respondents reported a 73.4% increase to their average aquatic operating expense in that time, from $320,000 to $555,000. The next greatest increases were reported by health clubs, up 43.2% from $324,000 to $464,000; schools, up 31.3% from $364,000 to $478,000; Ys, up 28.4% from $542,000 to $696,000; and parks, up 22.9% from $537,000 to $660,000. Respondents from camps actually reported a decrease in their average aquatic operating cost from 2024 to 2025, dropping 56.1% from $264,000 to $116,000.
Looking forward, rec centers also expect their average aquatic operating cost to increase at the fastest rate between 2025 and 2027, projecting a rise of 19.1% to $661,000. Smaller increases were projected by respondents from schools, up 7.9% to $516,000; parks, up 3.5%, to $683,000; and health clubs, up 1.1% to $469,000. Respondents from Ys projected virtually no change to their operating expenses between 2025 and 2027, with a decrease of 1% to an average of $689,000. Camps and colleges projected greater decreases, with camps projecting a 12.9% decrease to $101,000 from 2025 to 2027, and colleges projecting an 11.2% decrease to $358,000.
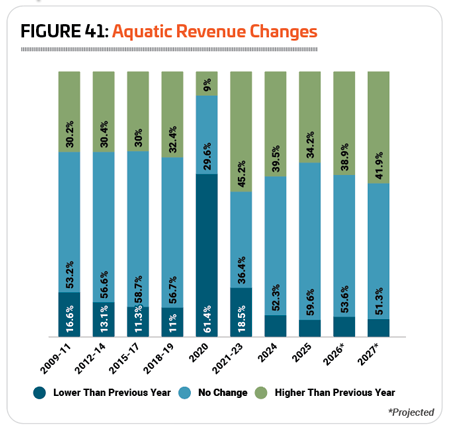
When it comes to aquatic revenues, respondents have been more likely to report inc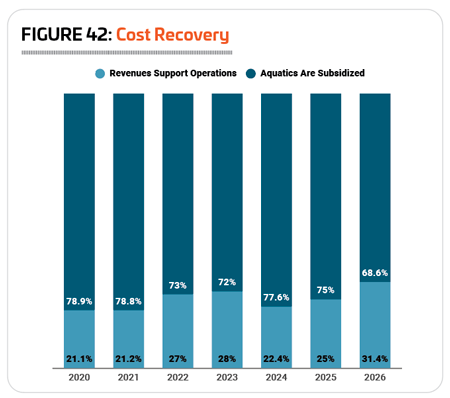 reases in the post-pandemic years than in previous years. From 2009 to 2019, around three in 10 respondents were likely to see their aquatic revenues increase, with a majority of respondents in each year reporting that their revenues were remaining steady year over year. The year 2020 obviously represents an outlier, with broad closures affecting facilities of all kinds, but especially aquatic facilities, and 61.4% of respondents saw their aquatic revenues fall.
But since 2020, respondents have been more likely to see increasing revenues than previously, though that number has fallen from an average of 45.2% for 2021-23 to 39.5% in 2024, and 34.2% in 2025. At the same time, the percentage of respondents reporting a decrease in revenues has also fallen, from an average of 18.5% from 2021-23 to 8.2% in 2024 and 6.2% in 2025. (See Figure 41.)
Looking forward, respondents are most likely to be anticipating either no change or an increase in aquatic revenues in 2026 and 2027. Some 53.6% are expecting revenues to hold steady in 2026, with 38.9% projecting an increase. And in 2027, 51.3% are expecting aquatic revenues to hold steady, while 41.9% are anticipating an increase.
Considered by facility type, respondents from health clubs, followed by rec centers, parks and schools were the most likely to report that their aquatic revenues increased from 2024 to 2025, with 40% of health clubs, 35.9% of rec centers, 35.8% of parks and 35.7% of schools reporting that they had seen an increase in aquatic revenues in this time period. Respondents from camps (24.1%) and colleges (21.2%) were the least likely to see an increase in aquatic revenues from 2024 to 2025.
Respondents from health clubs are the most likely to expect their aquatic revenues to increase in 2026, with two-thirds (66.7%) indicating that they are anticipating such an increase. They were followed by rec centers (48.7%), Ys (42.9%), schools (42.9%) and parks (42%). More than one in three camp respondents (31%) also expect to see their aquatic revenues increase in 2026, while just 15.4% of college respondents are anticipating an increase.
With regard to revenue, we also asked aquatic respondents whether their aquatic facilities generate enough revenue to support their operation or are subsidized via funding from other sources. 2026 saw the highest number yet reporting that their aquatic facility revenues support their aquatic operations at 31.4%, up from 25% in 2025. (See Figure 42.)
Respondents from health clubs were by far the most likely to report that their aquatic costs were paid for via aquatic revenues, with two-thirds (66.7%) indicating this was the case. They were followed by Ys, where 41.5% said their costs were paid for via their revenues. Smaller numbers of respondents from rec centers (29.7%), parks (28.7%), colleges (23.9%) and camps (22.7%) said that their aquatic operational costs were covered by their aquatic revenues. School respondents were least likely to cover their aquatic costs via revenues, with just 7.1% indicating this was the case.
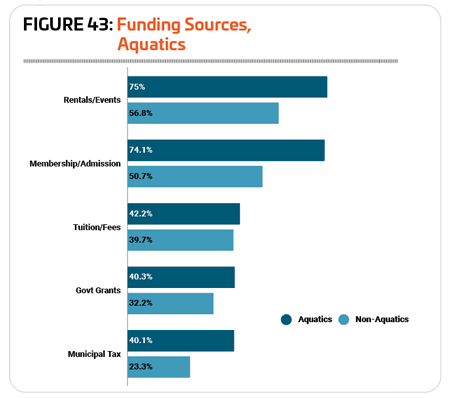
As in 2025, the most common sources of funding for aquatic facilities in 2026 were rentals and private events, as well as membership and admission fees. Three-quarters (75%) of aquatic respondents said that rentals and private events were a source of funding for their facilities, compared with 56.8% of non-aquatic respondents. Just slightly fewer—74.1%—aquatic respondents said that membership and admission fees were a source of funding for their facilities, compared with 50.7% of non-aquatic respondents. Other relatively common sources of funding for aquatic facilities in 2026 include: tuition and fees (42.2%), government grants (40.3%), and city or municipal taxes (40.1%). (See Figure 43.)
As is always the case, respondents with aquatic facilities were more likely than those without to report that they had taken action to reduce their costs over the past few years. Some 82.6% of aquatic respondents said they had taken such action, up from 81.4% in 2025, while 78.2% of non-aquatic respondents had done so, up from 76.9% in 2025.
The most common methods used by aquatic respondents to reduce their costs included: incre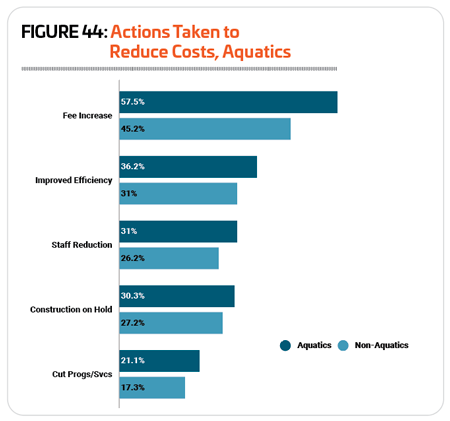 asing fees (57.5%, compared with 45.2% of non-aquatic respondents); improving energy efficiency (36.2% vs. 31%); staff reductions (31% vs. 26.2%); putting construction or renovation plans on hold (30.3% vs. 27.2%); and cutting programming or services (21.1% vs. 17.3%). (See Figure 44.)
Aquatic Programming
As usual, more than nine in 10 (93.2%) aquatic respondents said that they currently host various types of programming at their facilities—everything from learn-to-swim and water safety to aquatic fitness and competitive swimming opportunities. As was the case in 2025, a full 100% of aquatic respondents from colleges, schools, health clubs and Ys said that they currently host aquatic programming at their facilities. In addition, 92.3% of camp respondents, 91% of park respondents and 90% of rec center respondents currently offer aquatic programming of some kind.
The 10 most commonly offered aquatic programs in 2026 were:
1. Leisure swim opportunities (89.1%)
2. Learn-to-swim for children (81.2%)
3. Lifeguard training (79.4%)
4. Lap swim time (78.3%)
5. Aquatic exercise programs (66.5%)
6. Learn-to-swim for adults (60.6%)
7. Youth swim teams (57.7%)
8. Water safety programs (56.8%)
9. Swim meets and competitions (50%)
10. Programs for those with disabilities (38.5%)
The Y has long been a leader when it comes to aquatic programming, and respondents from Ys were the most likely to offer many different types of aquatic programs, including leisure swim time, learn-to-swim for children, lifeguard training, lap swimming, aquatic exercise programs, learn-to-swim for adults, youth swim teams, water safety programs, aquatic programs for those with disabilities, aqua-therapy, adult swim teams. Schools and school districts were most likely to host swim meets and competitions, school/collegiate swim teams, diving and diving teams, and water polo.
Some 17% of aquatic respondents in 2026 said that they were planning to add aquatic programs at their facilities over the next few years, up just slightly from 15.7% in 2025.
Respondents from Ys and rec centers were the most likely to be planning to add aquatic programs. Some 28.6% of Y respondents and 20.8% of rec center respondents said they would be doing so. They were followed by parks (17.4%), colleges (14.3%), camps (12.5%) and schools (11.1%). Just 5.6% of health club respondents said that they had plans to expand their aquatic programming lineup over the next few years.
The most commonly planned aquatic program additions in 2026 were:
1. Programs for those with disabilities (planned by 37.6% of those who will be adding programs, up from 34.2% in 2025)
2. Learn-to-swim for adults (24.8%, down from 30.8%)
3. Adult swim teams (20.8%, up from 17.1%)
4. Aqua-therapy (19.8%, up from 15.4%)
5. Learn-to-swim for children (16.8%, up from 14.5%)
6. Aquatic exercise programs (16.8%, down from 19.7%)
7. Swim meets and competitions (15.8%, up from 13.7%)
8. Water safety programs (14.9%, down from 16.2%)
9. Youth swim teams (11.9%, up from 8.5%)
10. Water polo (8.9%, down from 12.8%)
Editor’s Note: We take a deeper dive into trends in aquatic programming, as well as other issues for aquatic facilities not covered here, in our annual Aquatic Trends Report, featured in the January 2026 issue of Recreation Management. Visit RecManagement.com/aquatics-report.
Aquatic Facility Construction & Amenities
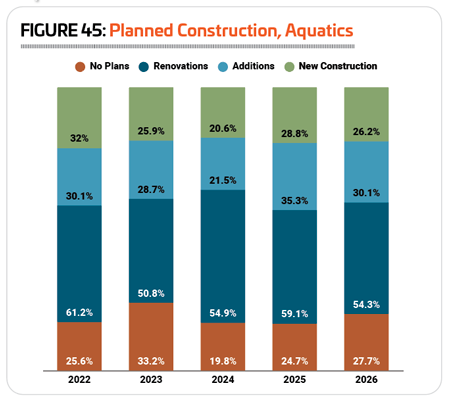
Aquatic respondents have been broken out in the general survey results since 2014, and in every year since then, they have been more likely than non-aquatic respondents to report that they are planning construction at their facilities. 2026 is no exception, with 72.3% of aquatic respondents indicating they had plans for construction. This is down slightly from 75.3% in 2025, but still more than non-aquatic respondents, 70.2% of whom said they are planning construction over the next few years.
Aquatic respondents were most likely to be planning renovations to their existing facilities. Some 54.3% of aquatic respondents in 2026 said they were planning renovations, down from 59.1% in 2025. Another 30.1% of aquatic respondents were planning additions to their existing facilities, down from 35.3% in 2025, and 26.2% were planning to build new facilities, down from 28.8%. (See Figure 45.)
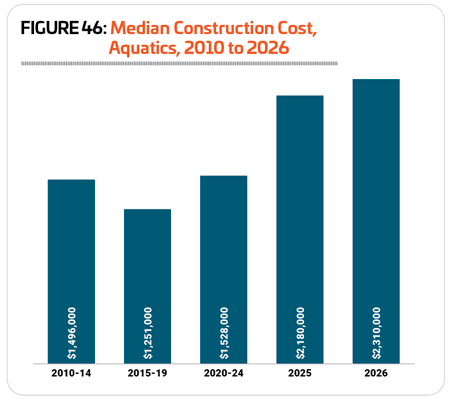
Median construction costs for aquatic facilities have been much higher over the past two years than previously. There was a 42.7% increase from the average median construction cost for 2020-24 of $1.528 million to the median for 2025 of $2.18 million. The median climbed even higher in 2026, rising 6% to $2.31 million. (See Figure 46.)
When it comes to outfitting aquatic facilities, there is a range of approaches, depending on the audience and programming of the facility. Here are the top 10 assets and features covered by this survey that were most common in aquatic respondents’ facilities in 2026:
1. Automatic chemical feeders (68.4%, representing virtually no change from 68.6% in 2025)
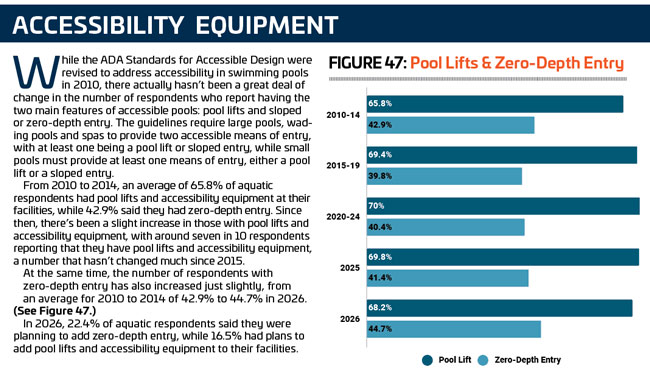
2. Pool lifts and accessibility equipment (68.2%, down from 69.8%)
3. Splash play area (55.6%, up from 51.9%)
4. Zero-depth entry (44.7%, up from 41.4%)
5. Diving boards (41.5%, down from 42.6%)
6. Waterslides (37.6%, up from 34.6%)
7. Water play structures (35.9%, up from 32.1%)
8. UV disinfection systems (30.1%, up from 24.4%)
9. Variable speed pumps (22%, up from 19.3%)
10. Variable frequency drive (16.7%, up from 15.3%)
Some 14.3% of aquatic respondents in 2026 said they had plans to add aquatic equipment and features to their facilities over the next few years, down from 16% in 2025. Respondents from parks were the most likely to have such plans, with 18.9% indicating they would be adding features and equipment to their aquatic facilities. They were followed by camps (12.5%) and rec centers (12.5%), health clubs (11.1%) and colleges (10%). Some 7.1% of Y respondents also said they would add features and equipment to their aquatic facilities. No school respondents reported that they had such plans.
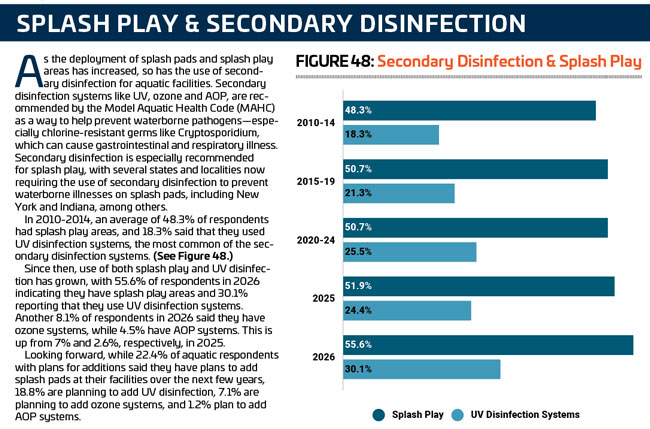
For the first time since 2012, splash play shares its spot as the most commonly planned addition for aquatic facilities in 2026. Some 22.4% of aquatic respondents with plans to add features and equipment at their facilities said they would be adding splash pads (down from 29.4% in 2025), as well as zero-depth entry (up from 19.3%) and water play structures (also up from 19.3%). Other commonly planned additions for aquatic facilities in 2026 include: UV disinfection systems (18.8%), waterslides (18.8%), poolside climbing walls (18.8%), pool lifts and accessibility equipment (16.5%), poolside cabanas (15.3%), variable speed pumps (14.1%), variable frequency drives (12.9%), and pool obstacle or ninja courses (12.9%).
20-Year Impact
When it comes to the factor that has had the greatest influence or impact on aquatic facilities and aquatic programming over the past 20 years, budgetary pressures held the No. 1 position, with 56.4% of aquatic respondents indicating that this was a top influence on their facilities and programs. Following closely was aging equipment and infrastructure, with 53.7% naming this a top influence.
Other factors commonly named as having an impact on aquatic facilities and programs included: economic and inflation-related challenges (28.7%), increasing participation and a growing number of users (24%), difficulty finding or retaining employees (21.8%), visitor expectations and demands (14.1%), and political challenges (12.9%). RM
