


In these pages, we’ll take a closer look at the responses to the Industry Report survey from those who manage college and university recreation, sports and fitness facilities. This group comprised 12.8% of the total survey response in 2026, virtually unchanged from 13% in 2025 and 13.1% in 2024.
The largest number of college respondents were from the Midwestern region of the U.S., with some 42.9% indicating they call the Midwest home. The Northeast followed, with 22% of college respondents reporting from this region. Smaller numbers of college respondents were from the South Central (16.5%), Western (11%) and South Atlantic (7.7%) regions of the U.S.
Slightly less than half of college respondents (46.2%) said that they were located in suburban communities. Another 29.7% were located in urban areas, with the remaining 24.2% indicating that they were located in rural communities.
On average, college respondents reached an average of 101,880 patrons annually, a number likely skewed by the smaller sample size represented here. The median number of people served by college respondents on an annual basis was much smaller at 17,860. Some 39.4% of college respondents said they serve 10,000 or fewer patrons annually, while another 26% said they reach between 10,000 and 50,000. Another 10.6% serve between 50,000 and 100,000, and 24% serve more than 100,000 on an annual basis.
On average, college respondents said that they manage 5.2 individual facilities, virtually un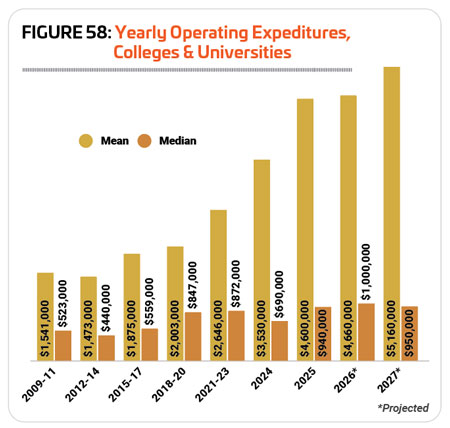 changed from 5.5 in 2025. Some 61.5% of college respondents in 2026 said that they manage between one and three separate facilities, compared with 57.1% of non-college respondents. At the other end of the spectrum, just 10.8% of college respondents manage 10 or more facilities, compared with 22.2% of non-college respondents.
In 2026, college respondents were slightly less likely than their counterparts from other cohorts to report that they had partnered with other organizations. Some 86% of college respondents said they had formed such partnerships, compared with 88% of non-college respondents.
College respondents were much more likely than others to report that they had partnered with other colleges and universities. Some 68% of college respondents said they had partnered with colleges and universities, compared with just 30.5% of non-college respondents. The next most common partners for college respondents were: local schools (33% of college respondents had partnered with local schools); state government (26%); local government (21%); and nonprofit organizations (19%).
College & University Costs & Revenues
From 2010 to 2020, operating budgets for college facilities increased at a steady clip, with the rate of increase for the mean outpacing the median at a much faster clip. The median cost increased 30% from $523,000 in 2009-11 to $847,000 in 2018-20, while the mean increased 62% from $1.541 million in 2009-11 to $2.003 million in 2018-20. Generally, when means increase faster than medians, this means there is a small concentration of high spenders, while lower spenders are actually much more common. The same trend continues for changes between 2018-20 to 2024, with the mean increasing by 76.2% from $2.003 million to $3.53 million, and the median actually falling 18.5%, from $847,000 to $690,000.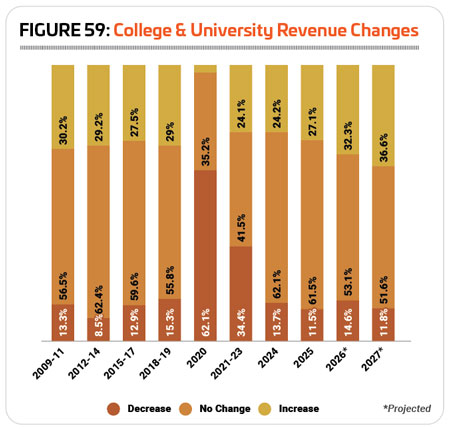
From 2024 to 2025, the median increased more than the mean, though the rates of increase were much closer together than in previous years. Mean operating costs increased 30.3% from $3.53 million in 2024 to $4.6 million in 2025, while the median increased 36.2% from $690,000 to $940,000 in that same time period.
Looking forward, college respondents are expecting their operating costs to increase at a much slower rate over the next two years. They projected a 12.2% increase to mean spending from $4.6 million in 2025 to $5.16 million in 2027, while median spending is expected to increase just 1.1% from $940,000 to $950,000. (See Figure 58.)
When it comes to revenues, college respondents are most likely to report stability over time, with the largest number of respondents in most years indicating that revenues have held steady, and smaller numbers reporting decreases or increases to revenues. This trend was obviously interrupted amidst the closures associated with the COVID pandemic, and in 2020, 62.1% of college respondents saw their revenues drop, while 35.2% saw no change and just 2.7% reported an increase. The years following continued to show a bit more instability than is typical for college respondents, but 2024 and 2025 show a return to pre-pandemic numbers, with the greatest number of college respondents—62.1% in 2024 and 61.5% in 2025—reporting that their revenues were holding steady year-over-year. (See Figure 59.)
Looking forward, college respondents are slightly more likely to expect revenue increases, though a majority still expect their revenues to remain the same. In 2026, 32.3% of college respondents are anticipating revenues to rise, while 53.1% expect no change, and in 2027, 36.6% expect revenues to rise, while 51.6% expect no change.
On average, college respondents earn back 46.3% of their operating costs via revenues. Around one-third of college respondents (33.7%) said they earn back 30% or less of their costs via revenues, compared with 25.4% of non-college respondents. This is down from 2025, when 38.8% of college respondents said they earned back 30% or less of their operating costs. On the other hand, 26.1% of college respondents in 2026 said they earn back at least 70% of their operating costs via revenues, compared with 34% of non-college respondents.
College and university respondents were most likely to get funding for their facilities via tuition and fees, and they were much more likely than other types of respondents to name tuition and fees as a source of funding. Some 83.5% of college respondents said tuition and fees were a source of funding for their facilities, compared with 35.2% of non-college respondents. This was the only funding source covered by the survey that was more likely to support college respondents’ facilities than other types of respondents.
The next most common sources of funding for college respondents’ facilities include: facility rentals and private events (59.3% of college respondents named this as a funding source); membership and admission fees (54.9%); private donations from individuals (33%); and “other” revenue sources (23.1%).
College respondents were somewhat more likely than others to report that they had taken action over the past few years to reduce their operating costs. In 2026, 83.9% of college respondents said they had taken such action, up from 80.2% in 2025. Some 80.3% of non-college respondents in 2026 said they had taken measures to reduce their costs.
As was the case in 2025, college respondents were most likely to reduce their costs through staff reductions. Some 36.3% of college respondents said they had reduced staff in order to cut their costs, compared with 28.3% of non-college respondents. The next most common methods college respondents relied on to reduce their expenses include: increasing fees (33% of college respondents increased fees, vs. 55% of non-college respondents); cutting programming or services (33% vs. 17.5%); putting construction or renovation plans on hold (28.6% vs. 29.2%); and reducing their hours of operation (28.6% vs. 15.6%).
In addition to cutting staff, programs and services and hours of operation, college respondents were also more likely than other cohorts to report that they had instituted a h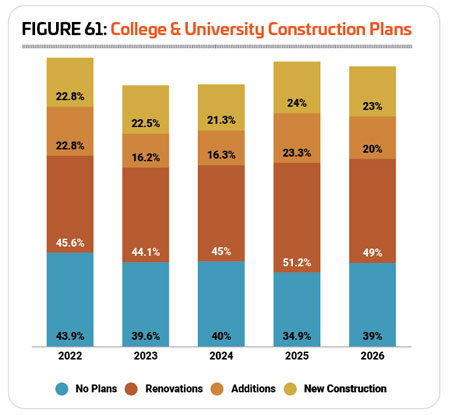 iring freeze (20.4% vs. 9.3%), or temporarily closed facilities (6.5% vs. 4.1%).
College Facility Use, Amenities & Construction
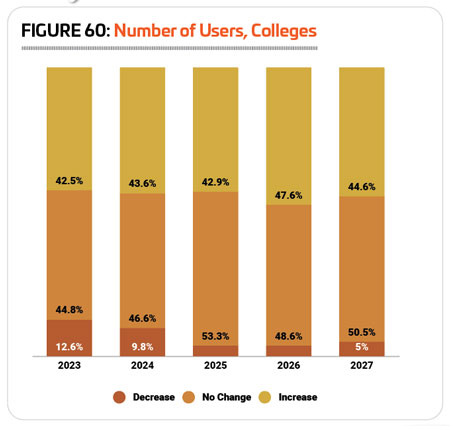
College respondents are usually most likely to report that the number of people using their facilities has either remained the same or increased from one year to the next. From 2024 to 2025, 42.9% of college respondents said usage of their facilities increased, while 53.3% reported no change, and just 3.8% reported a decrease. (See Figure 60.)
In 2026, slightly more college respondents (47.6%) are expecting use of their facilities to increase, while 48.6% expect no change and 3.8% expect a decrease. Those numbers shift only slightly for 2027, with 44.6% of college respondents anticipating an increase in facility use, 50.5% expecting no change, and 5% anticipating a decline.
College respondents were slightly less likely in 2026 to report that they have plans for construction over the next few years, though a majority—61%—do have such plans. This is down from 65.1% in 2025, but still the third highest number of college respondents with construction plans in 20 years (the second highest was 62.6% in 2008).
Park respondents were most likely to be planning renovations to their existing facilities, with 49% indicating they had renovations planned, down from 51.2% in 2025. Another 20% of college respondents were planning additions to their existing facilities, down from 23.3%, while 23% had plans for new construction, down from 24%. (See Figure 61.)
The median cost for construction spending on college and university facilities in 2026 was $1.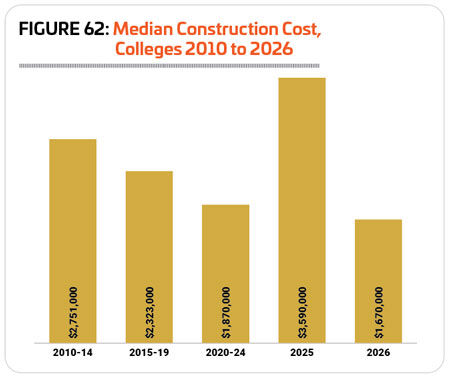 67 million, 53.5% less than the median in 2025 of $3.59 million. Despite the rather high median reported for 2025, the picture over time shows the median cost for construction of college facilities decreasing 39.3% from $2.751 million in 2010-14. (See Figure 62.)
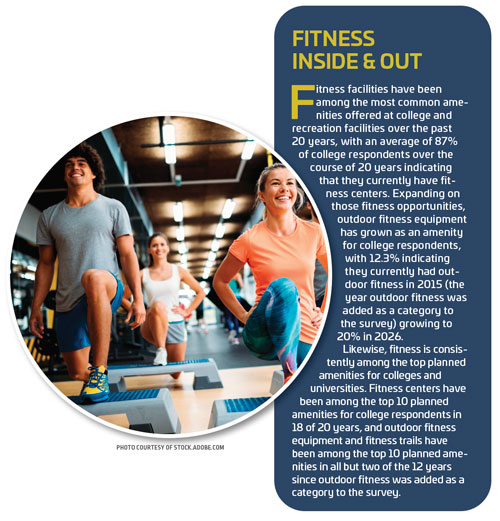
Whether they’re providing recreation and wellness or a place for college athletes to practice and perform, college and university facilities feature a range of amenities. The most common features found among college respondents’ facilities in 2026 include: fitness centers (83.2% of college respondents had fitness centers); locker rooms (81.6%); indoor courts for sports like basketball and volleyball (77.6%); classrooms and meeting rooms (66.4%); exercise studio rooms (66.4%); bleachers and seating (59.2%); natural turf sports fields (57.6%); outdoor courts for sports like basketball, tennis or pickleball (56%); indoor tracks (52.8%); and synthetic turf sports fields (51.2%).
While a majority of college respondents were planning construction, only 20.8% were planning to add features and amenities at their facilities over the next few years. This is down from 26.3% in 2024 and compares with 34% of non-college respondents in 2025 who have plans to add features to their facilities.
The most commonly planned additions for college respondents in 2026 include:
1. Synthetic turf sports fields (55.6% of college respondents with plans to add features said they would be adding synthetic turf fields)
2. Outdoor fitness equipment or fitness trails (22.2%)
3. Fitness centers (22.2%)
4. Disc golf courses (22.2%)
5. Exercise studio rooms (22.2%)
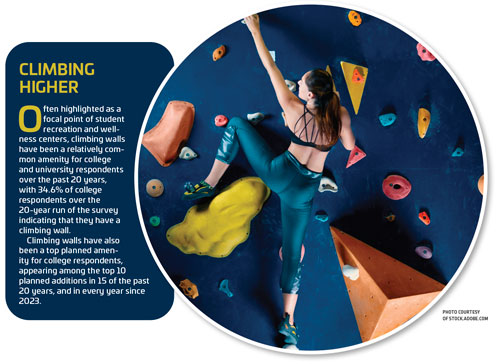
6. Climbing walls (22.2%)
7. Park shelters (14.8%)
8. Outdoor sports courts (11.1%)
9. Natural turf sports fields (11.1%)
10. Challenge courses or ropes courses (11.1%)
College & University
Programming
Most respondents from colleges and universities—95.9%—said that they provide programming of some kind at their facilities, down only slightly from 96.8% in 2025.
The most common programs found at college and university facilities in 2026 include: fitness programs (69.4% of college respondents offer fitness programs, down from 72% in 2025); group exercise (67.3%, down from 69.6%); mind-body balance programs such as yoga and tai chi (55.1%, down from 57.6%); tournaments and races (54.1%, up from 43.2%); individual sports activities such as running clubs (54.1%, up from 51.2%); adult sports teams (53.1%, up from 51.2%); personal training (44.9%, down from 46.4%); day camps and summer camps (43.9%, up from 40%); functional fitness (43.9%, down from 50.4%); and swimming programs (41.8%, down from 49.6%).
Just 16.2% of college respondents in 2026 said they had plans to add more programs at their facilities over the next few years, compared with 26.5% of non-college respondents. This is down slightly from 2025, when 17.2% of college respondents had plans to expand their programming lineup.
The programs college respondents are most likely to be planning to add over the next few years include:
1. Group exercise programs (up from No. 4 in 2025)
2. Day camps and summer camps (no change)
3. Functional fitness (up from No. 5)
4. Educational programs (up from No. 13)
5. Fitness programs (down from No. 1)
6. Youth sports (up from No. 20)
7. Tournaments and races (up from No. 15)
8. Aquatic exercise programs (down from No. 3)
9. Personal training (down from No. 8)
10. Teen programs (no college respondents had plans for teen programs in 2025)
 20-Year Impact
When asked what factor has had the greatest impact on college and university facilities and programming over the past 20 years, budgetary pressures held the No. 1 position, with 68.1% of college respondents indicating this was a top influence on their facilities and programs. This compares with 52.6% of non-college respondents.
The next most commonly named influences on college and university facilities and programs include: aging equipment and infrastructure (49.5%), and increasing participation and a growing number of users (19.8%).
College respondents were more likely than non-college respondents to point to risk management and safety improvements (18.7% vs. 8.9%), decreasing participation and a falling number of users (14.3% vs. 11.7%), and new technologies (13.2% vs. 7.7%) as major influences on their facilities and programs over the past
20 years. RM
