


In these pages, we’ll be examining the survey responses from professionals working for schools and school districts. These respondents made up 4.3% of the survey population in 2026, down from 11.8% in 2025.
The largest number of respondents from schools in 2026 were located in the South Atlantic region. Nearly one-third (32.1%) of school respondents said they were in the South Atlantic states. The smallest number—14.3%—were located in the South Central states, and the remainder were evenly divided among the Northeast, Midwest and West, with 17.9% of school respondents in each region.
School respondents were most likely to be located in suburban communities, with 39.3% indicating they call the suburbs home. Another 35.7% were located in urban communities, and 25% were located in rural areas.
More than two-thirds of school respondents (68.2%) said they worked for public schools. Another 20.5% said they worked for private, for-profit schools, and 11.4% worked for nonprofits.
On average, school respondents reached an average of 45,060 patrons annually, a number that is likely distorted by the small sample size, as the median number of patrons school respondents reach annually is just 3,400. Some 63.9% of school respondents said they serve 10,000 or fewer people per year. Another 19.4% reach 10,000 to 50,000, while 11.1% reach 50,000 to 100,000. Just 5.6% of school respondents said they serve more than 100,000 people annually.

On average, school respondents manage 8.3 individual facilities, up just slightly from 7.9 in 2025. Half of school respondents (50%) said they manage between one and three individual facilities, compared with 58% of non-school respondents. Another 29.5% of school respondents manage four to nine facilities, compared with 21.2% of non-school respondents. And 20.5% of school respondents said they manage at least 10 individual facilities, almost the same as non-school respondents (20.7%).
School respondents in 2026 were more likely to report that they had partnered with other organizations than non-school respondents. Some 94.3% of school respondents said they had formed such partnerships, compared with 87.5% of non-school respondents. This is similar to 2025, when 95.2% of school respondents formed partnerships, compared with 86.2% of non-school respondents.
The most common partners for school respondents in 2026 included local schools (57.1% of school respondents had partnered with other local schools), local government (51.4%), state government (48.6%), corporations and local businesses (31.4%), and nonprofit organizations (25.7%). The only type of partner that school respondents were more likely to partner with than non-school respondents was state government—48.6% vs. 34.1%.
When it comes to the primary audience for their facilities, school respondents were most likely to report that they work with teens ages 13 to 18. More than half (52.8%) of school respondents said their main audience was made up of teenagers, compared with just 3.8% of non-school respondents. Another 16.7% of school respondents said they primarily serve infants and toddlers, compared with just 0.5% of non-school respondents. Other audience groupings for school respondents include all ages (11.1% of school respondents said they work with all ages), children ages 4 to 12 (8.3%), college students (5.6%) and adults (5.6%).
School & School District Costs & Revenues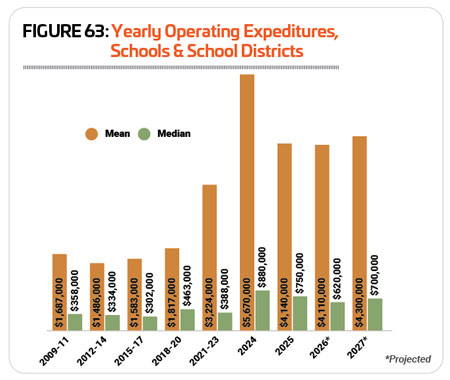
From 2010 to 2020, operating budgets for school facilities bucked the trend for other facility types, with the mean increasing at a slower rate than the median, rather than the reverse. The median operating cost for school respondents increased 29.3% from $358,000 in 2009-11 to $463,000 in 2018-20, while the mean increased just 7.7% in the same time period, from $1.687 million to $1.817 million. When the median increases faster than the mean, it generally shows that the overall rate of spending is increasing for lower spenders.
That trend reverses for 2018-20 to 2024, with the mean increasing 212% from $1.817 million in 2018-20 to $5.67 million in 2024, and the median increasing 90% in that same time frame, from $463,000 to $880,000. This reversal reveals a small concentration of big spenders at the top of the spread, with the larger number of respondents who spend less increasing their spending as well, though at a slower rate.
That said, 2024 represents something of an anomaly for school districts in terms of operating costs, as revealed by a drop for both the mean and median in 2025. Mean spending fell 27% from $5.67 million in 2024 to $4.14 million in 2025, while median spending also fell, by 14.8% from $880,000 to $750,000.
Looking forward, school respondents are expecting their operating costs to increase at a slower pace over the next two years. They projected a 3.9% increase to mean spending, from $4.14 million in 2025 to $4.3 million in 2027, while median spending is actually projected to decline by 6.7% from $750,000 to $700,000. (See Figure 63.)
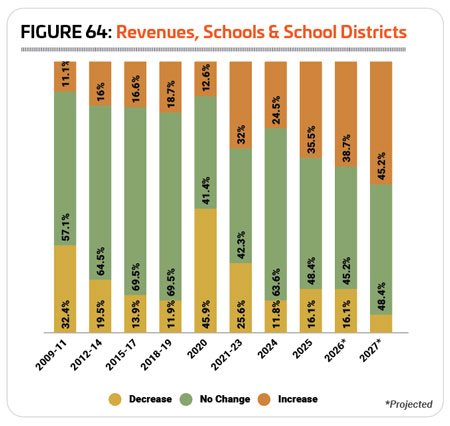
In pre-pandemic survey years, schools were most likely to report stability in their revenues, with a majority indicating their revenues remained the same year-over-year from 2009 through 2019. Like everyone else, school respondents saw this stability upset amid the closures and other challenges of the pandemic. Interestingly, in the years following the pandemic, school respondents are somewhat more likely to report that their revenues are increasing than they were leading up to 2020. The highest number of school respondents reporting increasing revenues before 2020 was 18.7% (2018-19), but in 2021-23, 32% of school respondents saw their revenues increase. Even allowing for a period of recovery in 2021 to 2023, one can see that school respondents continue to be more likely to report increasing revenues than they were prior to the pandemic, with 24.5% reporting an increase in 2024 and 35.5% reporting that their revenues increased in 2025. (See Figure 64.)
That said, school respondents continue to be most likely to report stable revenues, with the greatest number reporting no change in 2021-23 (42.3%), 2024 (63.6%) and 2025 (48.4%).
Looking forward, school respondents are slightly more likely to expect that their revenues will increase in 2026 and 2027, with 38.7% expecting an increase in 2026 and 45.2% expecting an increase in 2027.
On average, school respondents in 2026 earn back 44.6% of their costs via revenues, down from 47.2% in 2025. Some 31% of school respondents said they earn back 30% or less of their costs via revenues, compared with 26.3% of non-school respondents. At the other end of the spectrum, 20.7% of school respondents said they earn back more than 70% of their operating costs via revenues, compared with 33.5% of non-school respondents.
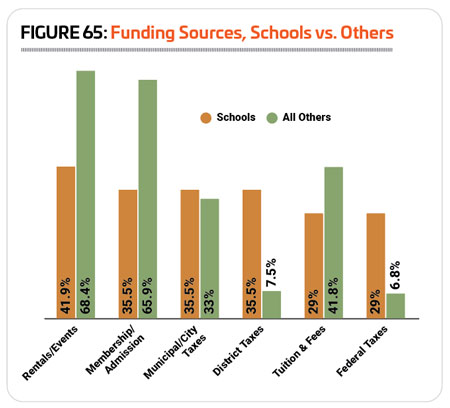 The most common sources of funding for school respondents’ facilities looks a bit different from other respondents. While the most common funding source for schools was also facility rentals and private events, with 41.9% of school respondents indicating they funded their facilities this way, non-school respondents were much more likely to rely on rentals and events as a source of funding (68.4%). The next most common methods of funding for schools were membership and admission fees, city or municipal taxes, and district taxes, with 35.5% of school respondents naming each of these categories as sources of funding for their facilities. While they were much less likely than non-school respondents to rely on membership and admission fees (35.5% of schools vs. 65.9% of non-school respondents), they were more likely to rely on city taxes (35.5% vs. 33%) as well as district taxes (35.5% vs. 7.5%). School respondents were also more likely than others to fund their facilities via federal taxes—29% of school respondents said they received federal tax dollars, compared with just 6.8% of non-school respondents. (See Figure 65.)
School respondents were somewhat less likely than others to report that they had taken action over the past few years to reduce their operating expenses, though the number who had done so increased in 2026. Some 75% of school respondents said they had taken measures to reduce their costs, up from 60% in 2025. This compares with 81.1% of non-school respondents in 2026 who had acted to reduce their operating expenses, virtually unchanged from 81.3%.
School respondents were most 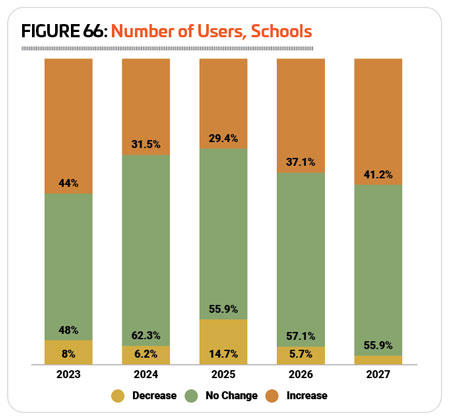 likely to report that they had increased their fees in order to boost their bottom line, with 31.3% of school respondents indicating they had increased fees. This is up substantially from 2025, when 20% of school respondents reported increasing fees. The next most common methods school respondents used to reduce their operating costs included: improving energy efficiency (28.1% of school respondents in 2026 said they had done so, compared with 29% in 2025); reducing staff (21.9% vs. 13% in 2025); putting construction or renovation plans on hold (21.9% vs. 22% in 2025); and cutting programs or services (18.9% vs. 10% in 2025).
School Facility Use, Amenities & Construction
In most years, school respondents are most likely to report that the number of people using their facilities holds steady. From 2024 to 2025, 55.9% of school respondents said the number of people using their facilities remained unchanged, while 29.4% reported an increase and 14.7% reported a decrease. (See Figure 66.)
In 2026, more school respondents expect the number of people using their facilities to either increase (37.1%) or remain the same (57.1%), while just 5.7% are anticipating a decrease. And looking forward to 2027, those numbers shift even more, with 41.2% anticipating increasing usage, 55.9% expecting no change and just 2.9% expecting a decrease.
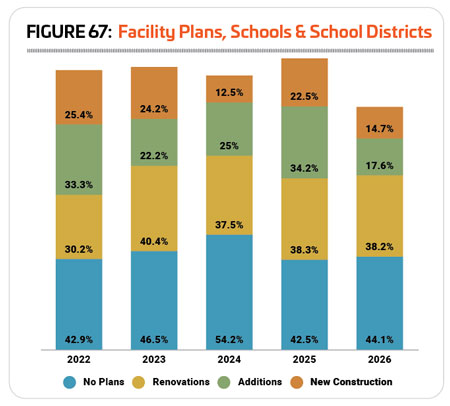 School respondents were slightly less likely in 2026 to report that they have plans for construction over the next few years. Some 55.9% of school respondents in 2026 said they have plans for construction, down from 57.5% in 2025. This is exactly the average number of school respondents over the entire course of the survey who reported having construction plans (55.9%).
School respondents in 2026 were most likely to be planning renovations to their existing facilities, with 38.2% indicating they would pursue renovations, virtually unchanged from 38.3% in 2025. Another 17.6% said they are planning additions to their existing facilities, down from 34.2% in 2025, and 14.7% are planning new construction, down from 22.5%. (See Figure 67.)
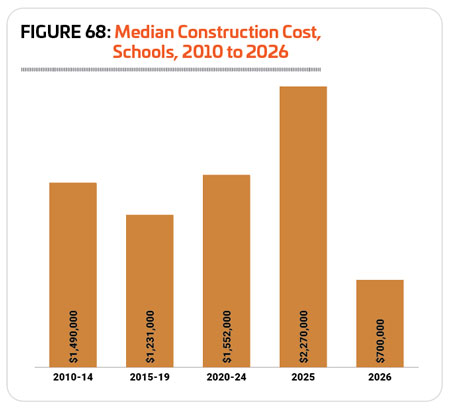
The median cost for construction spending on school and school district facilities in 2026 was just $700,000, a 69.2% decrease from the median in 2025 of $2.27 million. Median construction costs for school respondents have varied a great deal since 2010, but the number reported for 2026 is the second lowest in the history of the survey. The lowest median construction cost for schools was reported in 2024, at just $100,000. (See Figure 68.)
School respondents’ facilities generally feature amenities that support a combination of youth sports, physical education and play opportunities for younger kids during recess. The features most commonly found among school and school district respondents’ facilities in 2026 include: locker rooms (70.7% of school respondents said their facilities included locker rooms); bleachers and seating (70.7%); classrooms and meeting rooms (65.9%); indoor courts for sports like basketball and volleyball (61%); natural turf sports fields (58.5%); outdoor tracks (58.5%); concessions (53.7%); outdoor courts for sports like basketball, tennis and pickleball (48.8%); fitness centers (46.3%); playgrounds (43.9%); Wi-Fi services (43.9%); and synthetic turf fields (43.9%).
 Just 13.6% of school respondents in 2026 said they had plans to add features and amenities to their facilities over the next few years, down from 20.2% in 2025 and 43.3% in 2024.
This compares with 33.1% of non-school respondents in 2026 who are planning to add features at their facilities.
The most commonly planned additions for school respondents in 2026 were synthetic turf sports fields. Half (50%) of schools with plans to add features at their facilities are planning to add synthetic turf. Other additions planned by school respondents include outdoor sport courts, open spaces like gardens and natural areas, fitness centers, bleachers and seating. Some 16.7% of school respondents with plans to add features at their facilities said they would be adding these.
School & School District Programming
All 100% of school respondents said that they currently offer programming of some kind at their facilities, up from 98.3% in 2025.
The most common types of programming offered by school respondents in 2026 include: educational programs (65.6% of school respondents said they offer educational programs, down from 69.4% in 2025); youth sports (56.3%, down from 80.2%); day camps and summer camps (46.9%, up from 35.5%); fitness programs (46.9%, down from 52.1%); tournaments and races (46.9%, down from 50.4%); holiday events and other special events (37.5%, down from 38.8%); swimming programs (34.4%, up from 21.5%); individual sports activities like running clubs (34.4%, down from 43.8%); group exercise programs (28.1%, down from 32.2%); and programs for those with disabilities (28.1%, down from 33.1%).
Respondents from schools and school districts were the least likely in 2026 to be planning to add programming at their facilities over the next few years. Just 11.4% of school respondents had plans to add programs, compared with 25.8% of non-school respondents. This is down from 2025, when 12.5% of school respondents had plans to add programs.
The programs school respondents are most likely to be planning to add over the next few years include:
1. Adaptive sports (up from No. 18 in 2025)
2. Nutrition and diet counseling (no school respondents in 2025 planned to add nutrition and diet counseling)
3. Environmental education (up from No. 15)
4. Mind-body balance programs like yoga and tai chi (up from No. 12)
5. Holiday events and other special events (up from No. 13)
School respondents did not choose any other program types when selecting those they would be adding to their program lineup. Interestingly, none of these top five planned programs appeared in the list of 10 most commonly planned program additions for 2025.
20-Year Impact
When asked what factor has had the greatest impact on school and school district facilities and programming over the past 20 years, budgetary pressures held the No. 1 position, with 57.1% of school respondents indicating this was a top influence on their facilities and programs. The next most commonly named influences on school and school district facilities include: aging equipment and infrastructure (53.6%), and economic and inflation-related challenges (39.3%).
School respondents were more likely than non-school respondents to name difficulty finding or retaining employees (28.6% vs. 20.4%), community involvement in facility planning (7.1% vs. 4.3%), and legal and regulatory challenges (7.1% vs. 3.8%) as major influences on their facilities and programs over the past 20 years. RM
