


In these pages, we’ll examine the response from professionals working for YMCAs, YWCAs, JCCs and Boys & Girls Clubs, or other similar, usually nonprofit, facilities. This group made up 11.4% of all the respondents in 2026, virtually unchanged from 11.8% in 2025.
Y respondents were most likely to be located in the Northeastern or Midwestern regions of the U.S. Some 26.9% of Y respondents were located in each of these regions. The next largest group—20.5%—said they were from the South Atlantic states, while 15.4% were from the South Central region. The smallest number of Y respondents—10.3%—were located in the Western region of the U.S.
Respondents from Ys were most likely to be located in suburban communities, with more than half (52.6%) indicating that they call the suburbs home, up from 50% in 2025. Another 33.3% were located in rural communities (up from 31.9%), and 14.1% were located in urban areas (down from 18.1%).
As one would expect, 96.6% of Y respondents said that they work for nonprofit organizations. This compares with just 18.2% of non-Y respondents. The remaining Y respondents were evenly split between for-profit (1.7%) and public or governmental (1.7%) organizations.
On average Y respondents said that they reach an average of 90,370 people annually, up from 75,370 in 2025. That said, the median number of patrons served by Ys in 2026 was 12,860, and 60.6% of Y respondents said that they serve less than 20,000 people on an annual basis. Another 12.8% said that they reach 20,000 to 50,000 people, while 5.3% reach 50,000 to 100,000. Some 11.7% reach between 100,000 and 200,000 people, and 9.6% of Y respondents said that they serve more than 200,000 patrons on an annual basis.
 Y respondents in 2025 managed an average of 5.3 individual facilities, representing no change from 2025. They were more likely than other respondents to report that they manage just a single facility. Some 43% of Y respondents said they manage just one facility, compared with 32.1% of non-Y respondents. Another 27.2% of Y respondents said that they manage two or three individual facilities. Some 7% manage four or five individual facilities, and 7% manage between six and nine facilities. The rest of the Y respondents—15.8%—said that they manage at least 10 individual facilities.
Ys are always among those most likely to report that they have formed partnerships with other organizations, and 2026 is no exception, with 100% of Y respondents indicating that they had formed such partnerships. This compares with 86.2% of non-Y respondents and is up from 98.5% in 2025.
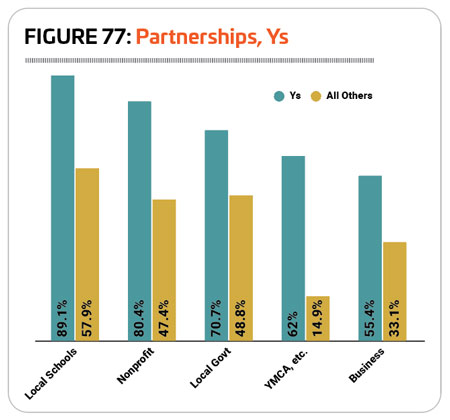
Ys continue to be more likely to engage with every kind of partner covered by the survey than non-Y respondents, other than private health clubs. The most common partners for Ys were local schools, with 89.1% of Y respondents indicating they had partnered with local schools. This is up from 81% in 2025, and compares with 57.9% of non-Y respondents who partnered with local schools in 2026. (See Figure 77.)
The next most common partners for Ys were nonprofit organizations (80.4% of Ys had partnered with nonprofits, compared with 47.4% of non-Y respondents), local government (70.7% vs. 48.8%), YMCAs and similar organizations (62% vs. 14.9%) and corporations or local businesses (55.4% vs. 33.1%). More than half of Y respondents had also partnered with colleges and universities (54.3%) or state government (54.3%), and nearly half (45.7%) had partnered with health care or medical facilities.
Known for offering a vast range of programming opportunities from fitness and swimming to sports teams and more, Ys and similar facilities are most likely to cater to all ages. Some 60.2% of Y respondents said that their audience is made up of all ages, compared with 42.8% of non-Y respondents.
Smaller numbers of Y respondents said that their primary audience was made up of adults (16.1%) or children (15.2%). The smallest numbers of Y respondents said that their primary audience was made up of teens (3.2%), seniors (3.2%), infants and toddlers (1.1%) or college students (1.1%).
Y Costs & Revenues
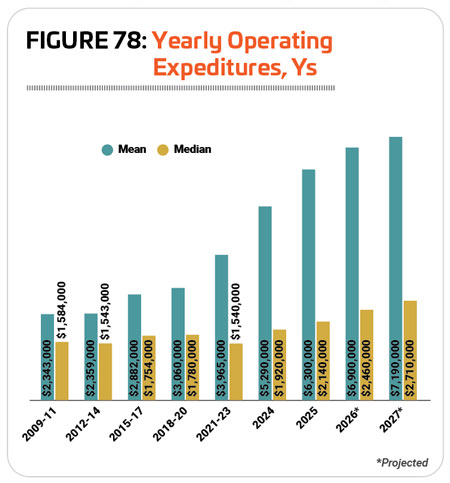 From 2010 to 2020, mean spending for Y respondents increased at about twice the rate of median spending, which shows that there was a smaller proportion of respondents spending much more, while the average Y respondent had a much lower annual operating cost. Mean spending increased by 30.6% from $2.343 million in 2009-11 to $3.06 million in 2018-20, while the median spending increased by 15%, from $1.584 million to $1.78 million, in that same time period.
As the survey instrument changed, the effect becomes even more dramatic, as those spenders at the top of the spread were able to select even higher amounts. This explains why mean spending increased 72.9% from $3.06 million in 2018-20 to $5.29 million in 2024. Because of this change, changes to median spending are a more reliable indicator of how much spending has increased over time. Median spending rose by 7.9% from $1.78 million in 2018-20 to $1.92 million in 2024.
The difference is far less stark from 2024 to 2025. Mean spending increased by 19.1% from $5.29 million in 2024 to $6.3 million in 2025, while median spending increased 11.5% in that same time frame, from $1.92 million to $2.14 million.
Looking forward, lower spenders expect their costs to begin to rise faster than the top spenders. Mean spending is expected to increase by 14.1% from $6.3 million in 2025 to $7.19 million in 2027, while median spending is expected to increase at a faster rate of 26.6%, from $2.14 million in 2025 to $2.71 million in 2027. (See Figure 78.)
When it comes to revenues, more than half of Y respondents reported increases in almost every year leading up to the pandemic in 2020. (The exceptions were 2009, 2011 and 2016, when 40%, 47.5% and 47.9% of Y respondents reported increasing revenues, respectively.) As elsewhere, the pandemic had a dramatic effect on revenues for Y respondents, with the majority—83.9%—reporting that their revenues fell in 2020.
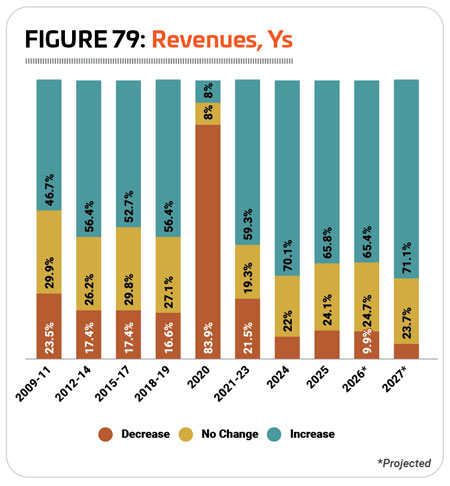 Following the pandemic, Y respondents have been even more likely to report increasing revenues, and 2024 represented a high point, with 70.1% of Y respondents indicating their revenues had increased year-over-year—more than in any previous year. That number fell slightly in 2025, though nearly two-thirds of Y respondents (65.8%) said their revenues increased in 2025. Another 24.1% said their revenues held steady, while 10.1% of Y respondents said their revenues decreased in 2025. (See Figure 79.)
Looking forward, Y respondents largely expect this trend to continue, with 65.4% expecting revenues to increase in 2026 and 71.1% expecting an increase in 2027.
On average, Y respondents in 2026 earn back 74% of their operating costs via revenues, up from 69.8% in 2025. Only 5% of Y respondents said that they earn back 30% or less of their costs via revenues, compared with 29.1% of non-Y respondents. At the other end of the spectrum, 56.3% of Y respondents said they earn back at least 70% of their costs via revenues, compared with just 30.1% of non-Y respondents.
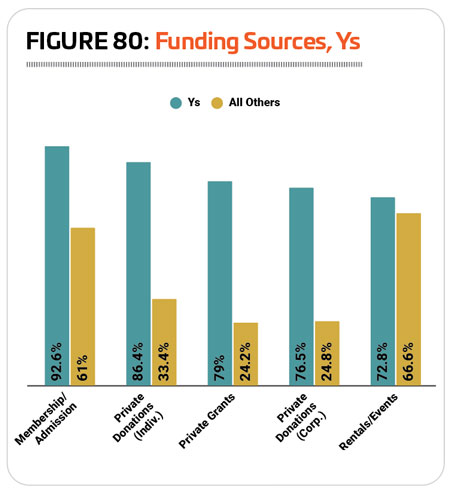
Unlike other respondents, Ys are very likely to fund their facilities through a variety of means, with the most common being membership and admission fees. Some 92.6% of Y respondents said membership and admission fees help fund their facilities, compared with 61% of non-Y respondents. The next most common methods of funding for Ys include: private donations from individuals (86.4% of Y respondents vs. 33.4% of non-Y respondents); private grants (79% vs. 24.2%); corporate donations (76.5% vs. 24.8%); and facility rentals and private events (72.8% vs. 66.6%). (See Figure 80.)
 More than half of Y respondents also said they received funding for their facilities via: government grants (69.1%) and donations from nonprofit organizations (60.5%).
Y respondents in 2026 were slightly less likely to report that they had taken action over the past few years to reduce their operating costs. Some 86.4% of Y respondents said they had done so, down from 89.1% in 2025. This compares with 80.1% of non-Y respondents in 2026 who had acted to reduce their costs.
The most common measures taken by Y respondents to cover their operating expenses included: increasing fees (59.3% of Y respondents in 2026 said they had increased fees, compared with 51.2% of non-Y respondents); reducing staff (40.7% vs. 27.8%); improving energy efficiency (37% vs. 33.5%); putting construction or renovation plans on hold (25.9% vs. 29.5%); or cutting programs and services (21% vs. 19.1%).
Y Facility Use, Amenities & Construction
Respondents from Ys have been very likely to report that the number of people using their facilities is on the rise since the pandemic. Some 81.6% reported that use of their facilities increased in 2023, while 74.1% reported an increase in 2024 and 75.3% reported an increase in 2025. At the same time, the number reporting a decline in use of their facilities dropped from 10.2% in 2023 to 2.2% in 2024 before increasing again slightly to 5.4% in 2025. (See Figure 81.)
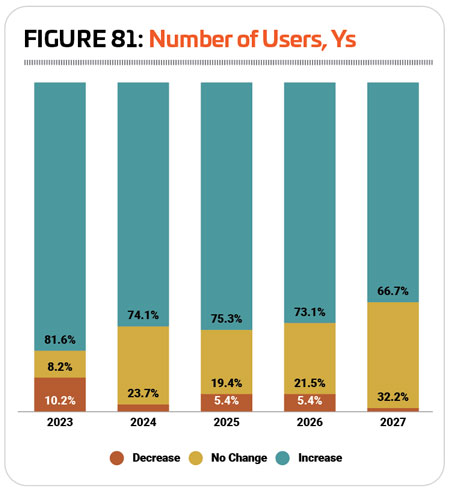
Looking forward, Y respondents largely expect more of the same, with 73.1% anticipating use of their facilities to increase in 2026 and 66.7% anticipating an increase in 2027.
More Y respondents in 2026 said that they were planning construction over the next few years than in any previous year of the survey. Some 80.2% of Y respondents in 2026 said they had construction plans, compared with 70.5% of non-Y respondents. This is up from 79.1% of Y respondents in 2025 who had construction plans.
Y respondents in 2026 were most likely to be planning renovations to their existing facilities. Some 61.5% of Y respondents said they had plans for renovations. Another 31.9% were planning additions to their existing facilities, while 17.6% were planning new construction. (See Figure 82.)
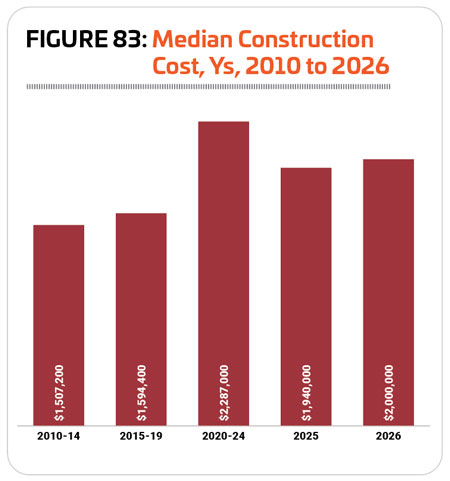
The median cost for construction spending on Y facilities in 2026 was $2 million, a 3.1% increase over 2025’s median of $1.94 million. Since 2010-14, median spending on Y facility construction increased 51.7%, from $1,507,200 to $2,287,000 in 2020-24 before falling 15.2% to $1.94 million in 2025. The median for 2026, $2 million, represents a 32.7% increase from the median for 2010-14. (See Figure 83.)
Y facilities feature a diverse array of features and amenities from locker rooms and fitness facilities to sports facilities, aquatics and more. The most common features found in Y respondents’ facilities in 2026 include: fitness centers with weights and cardio machines (81.7% of Y respondents had fitness centers, virtually unchanged from 81.5% in 2025); exercise studio rooms (81.7%, up from 80.9%); locker rooms (75.2%, down from 77.8%); indoor courts for sports like basketball, volleyball or racquet sports (75.2%, down from 80.2%); childcare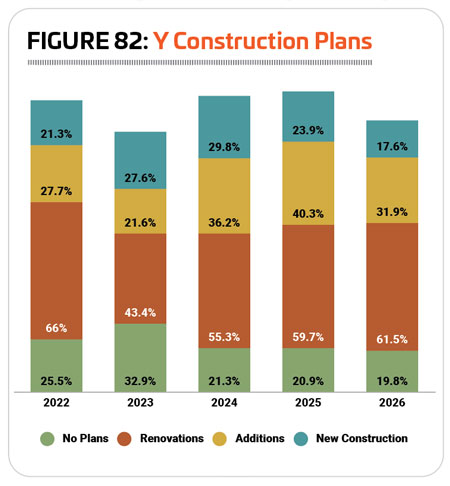 centers (72.5%, down from 74.7%); classrooms and meeting rooms (70.6%, down from 71.6%); Wi-Fi services (70.6%, up from 68.5%); indoor aquatic facilities (70.6%, down from 73.5%); playgrounds (67.9%, down from 75.3%); and bleachers and seating (54.1%, up from 52.5%).
Respondents from Ys were slightly less likely than others in 2026 to report that they had plans to add features and amenities to their facilities over the next few years. Some 29.3% of Y respondents in 2026 had such plans, compared with 32.7% of non-Y respondents. This is down from 2025, when 32.5% of Y respondents had plans to add features at their facilities.
The amenities that Y respondents are most likely to be planning to add over the next few years include:
1. Splash play areas (38.2% of Y respondents with plans to add features said they would add splash play)
2. Outdoor courts for sports like basketball, tennis and pickleball (26.5%)
3. Playgrounds (20.6%)
4. Park shelters (20.6%)
5. Outdoor aquatic facilities (20.6%)
6. Bleachers and seating (17.6%)
7. Natural turf sports fields (17.6%)
8. Indoor aquatic facilities (17.6%)
9. Indoor sports courts (14.7%)
10. Locker rooms (14.7%)
Y Facility Programming
 As usual, 100% of Y respondents said that they host programming of some kind at their facilities. This compares with 96.6% of non-Y respondents.
The most commonly offered program types for Y respondents in 2026 include: day camps and summer camps (91.2% of Y respondents host day camps and summer camps at their facilities, up from 89.6% in 2025); holiday events and other special events (84.6%, down from 90.3%); group exercise programs (82.4%, down from 83.6%); fitness programs (82.4%, virtually unchanged from 82.1%); mind-body balance programs like yoga and tai chi (81.3%, up from 79.1%); educational programs (78%, down from 79.1%); youth sports (74.7%, down from 75.4%); swimming programs (73.6%, down from 74.6%); functional fitness (70.3%, down from 73.1%); and daycare or preschool (70.3%, down from 77.6%).
More than half of Y respondents also provide: programs for active older adults (69.2% of Y respondents host programs for older adults); arts and crafts (69.2%); personal training (69.2%); teen programming (67%); aquatic exercise programs (65.9%); and programs for those with disabilities (50.5%).
Some 28.4% of Y respondents in 2026 said that they had plans to add programming options at their facilities over the next few years, down from 33.1% in 2025. This compares with 24.8% of non-Y respondents in 2026 who have plans to expand their programming lineup.
The programs Y respondents are most likely to be planning to add over the next few years include:
1. Adult sports teams (no change from 2025)
2. Adaptive sports programs (up from No. 8)
3. Environmental education programs (up from No. 18)
4. Teen programming (down from No. 2)
5. Youth sports teams (up from No. 6)
6. Programs for those with disabilities (down from No. 5)
7. Individual sports activities like running clubs (down from No. 4)
8. Performing arts programs (up from No. 9)
9. Tournaments and races (up from No. 21)
10. Aquatic exercise programs (up from No. 13)
Outreach & Impact
 In addition to offering a broad range of programming for their members and visitors to take part in, Y respondents tend to be involved in a range of initiatives for their members and communities. We asked respondents about their involvement in a variety of initiatives, from conservation to outreach to disadvantaged and disabled community members. Y respondents were more likely than any other cohort to have involvement in such initiatives. Some 96.7% of Y respondents were involved in at least one of the initiatives covered by the survey, compared with 79.1% of all other respondents.
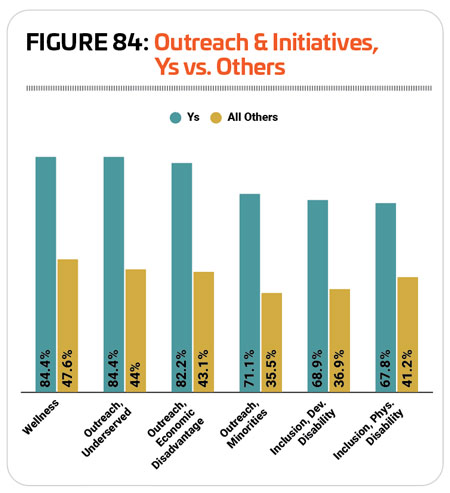
Y respondents were most likely to be involved in wellness initiatives, as well as outreach to underserved populations. Some 84.4% of Y respondents were involved in wellness initiatives, compared with 47.6% of non-Y respondents, and 84.4% of Y respondents were involved in outreach to underserved populations, compared with 44% of non-Y respondents. Other types of initiatives that Y respondents were most likely to be involved in include: outreach to economically disadvantaged populations (82.2% of Y respondents vs. 43.1% of non-Y respondents); outreach to minority populations (71.1% vs. 35.5%); inclusion initiatives for those with developmental disabilities (68.9% vs. 36.9%); and inclusion initiatives for those with physical disabilities (67.8% vs. 41.2%). (See Figure 84.)
Other initiatives that Y respondents were more likely than other respondents to get involved in include initiatives to reduce hunger and improve nutrition (46.7% vs. 15.1% of non-Y respondents), and regional or community disaster recovery assistance (14.4% vs. 10.7%).
When asked what factor has had the greatest impact on Y facilities and programming over the past 20 years, budgetary pressures held the No. 1 position, with 48.1% of Y respondents indicating this was a top influence on their facilities and programs. However, though they were most likely to name it a top concern, Y respondents were less likely to point to budgetary pressures as a top influence than other respondents, with 51.5% of non-Y respondents naming budgetary pressures as the No. 1 influence on their programs and facilities.
The next most commonly cited impacts on their facilities and programs for Y respondents include: aging equipment and infrastructure (46.8% vs. 50.4% of non-Y respondents); difficulty finding or retaining employees (33.8% vs. 19.2%); economic or inflation-related challenges (30% vs. 27.9%); and increasing participation or a growing number of users (19.5% vs. 22.5%). RM
