


Welcome to our annual State of the Industry Report, where we report on the results of our annual Industry Report survey. In the following pages, we’ll give you an overview of the responses of all 1,400-plus respondents to the survey, occasionally breaking information down by region, facility type, or some other relevant factor. We’ll look at the overall demographics of the respondents, along with what they had to say about their budgets and revenues, construction and programming plans, staffing trends, facility usage, top challenges, and more.
After that, we’ll report on the response from specific portions of the survey population, beginning with those whose facilities include swimming pools, waterparks, or splash play areas, on page 36. From there, we’ll turn to some of the major groups of respondents, including parks and recreation departments and districts (page 54), colleges and universities (page 70), schools and school districts (page 78), health clubs and fitness-related facilities (page 86), and finally, nonprofit, multiuse facilities like YMCAs, JCCs, and Boys & Girls Clubs (page 92). Still want more information? Surf on over to RecManagement.com and read up on the details from camp-related facilities, along with community and private recreation centers.
As if that weren’t enough (and we know it’s a lot!), we’ll also be reporting in next month’s issue on salary and career-related information from the survey in our Annual Salary Survey. And, as always, we will keep sending you a tidbit of data in our weekly Rec Report e-newsletter, along with the most up-to-date industry news, so be sure to sign up for a subscription if you’d like to stay in the loop.
Who Responded?
 This year saw an impressive response to the Industry Report survey, with more than 1,400 professionals providing detailed data about their facilities. Respondents tend to have a high level of experience and decision-making power, which we’ll cover in more detail in next month’s Salary Survey. To kick off this report, let’s take a look at the types of organizations, geographic regions, community types, and other information that helps paint a picture of who responded to this year’s survey.
While respondents to the survey have many different roles in their organizations, a majority hold higher-level, decision-making positions in their organizations. The largest number of respondents—39.5%—said they are directors. Another 17.4% are in administration and management positions, including administrators, managers, and superintendents. Some 15% hold operations and facility management positions, including operations managers, facility managers, building managers, and supervisors. Some 13.6% of respondents said they are the chairman, CEO, president, vice president, or owner of their organization or company. Another 8.1% of respondents have program and activity administration roles, including activity and program directors, managers, coordinators, specialists, coaches, and instructors. A handful of respondents—just 2%—said they are faculty or teachers, and 0.4% are in planning roles like architect, design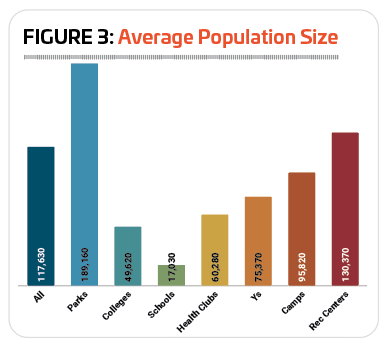 er, or consultant.
On average, respondents have been working in the recreation, sports and fitness industry for 23.1 years, with an average span of 12.6 years in their current positions.
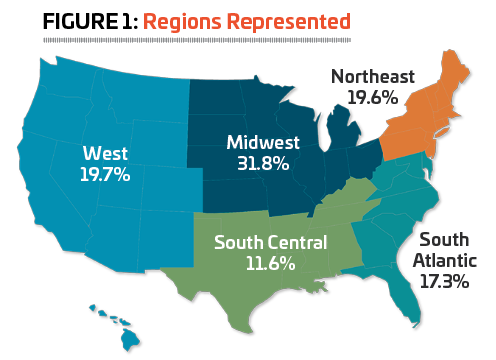
More than three in 10 (31.8%) respondents in 2024 were from the Midwest, including Illinois, Indiana, Iowa, Kansas, Michigan, Minnesota, Missouri, Nebraska, North Dakota, Ohio, South Dakota or Wisconsin. (See Figure 1.)
They were followed by the West, home to nearly one-fifth (19.7%) of the respondents. The West includes Alaska, Arizona, California, Colorado, Hawaii, Idaho, Montana, Nevada, New Mexico, Oregon, Utah, Washington and Wyoming.
A similar number of respondents (19.6%) were from the Northeast, which includes the states of Connecticut, Maine, Massachusetts, New Hampshire, New Jersey, New York, Pennsylvania, Rhode Island and Vermont.
Another 17.3% of survey respondents call the South Atlantic region their home. This includes Delaware, Florida, Georgia, Maryland, North Carolina, South Carolina, Virginia, Washington, D.C., and West Virginia.
Finally, 11.6% of respondents said they were from the South Central region, which includes Alabama, Arkansas, Kentucky, Louisiana, Mississippi, Oklahoma, Tennessee and Texas.
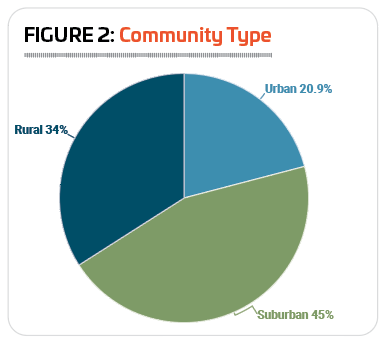
 When asked about what kind of community they work in, the largest number of respondents—45%—said they were located in suburban areas. Around another third (34%) work in rural areas, and 20.9% said they worked in urban communities. (See Figure 2.)
On average, respondents in 2025 said their facilities reached an average population size of 117,630 people, down somewhat from 143,307 in 2023, which was the most recent year in which we included this data point.
Respondents from parks and rec centers had the largest average population sizes, at 189,160 and 130,370, respectively. School respondents reached the smallest average population, at 17,030. (See Figure 3.)
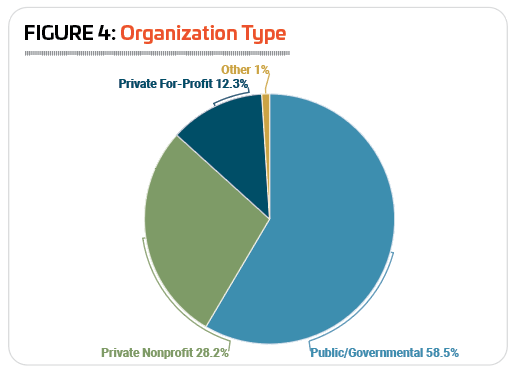
Slightly fewer respondents in 2025 were with public or governmental organizations than in 2024. In 2025, 58.5% of respondents said they were with government or public organizations, down from 67.9% in 2024. Another 28.2% of respondents were with private nonprofit organizations, up from 18.2%. Some 12.3% of respondents said they worked for private, for-profit organizations, down slightly from 13.4% in 2024. And 1% of respondents worked for “other” types of organizations. (See Figure 4.)
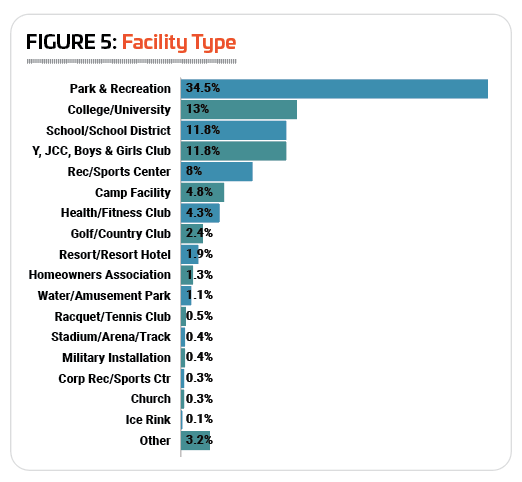 In 2024, the response from park districts and departments was dominant, with a jump of 10 percentage points in representation from the previous year to 42.5%. In 2025, the response from different types of organizations looks similar to previous years, with a smaller number—though still the largest portion of the respondents—hailing from parks and recreation departments, districts, and similar organizations. Some 34.5% of respondents said they were with parks organizations. They were followed by colleges and universities, with 13% of the response; schools and school districts at 11.8% (and a special thank you to those from this cohort who responded!); YMCAs, YWCAs, JCCs, Boys & Girls Clubs, and similar facilities, also at 11.8%; community or private recreation and sports centers, with 8%; private or youth camps, as well as campgrounds and RV parks, with 4.8%; and health and fitness clubs, along with medical fitness facilities, at 4.3%. (See Figure 5.)
Smaller numbers of respondents reported from other types of facilities, including: golf and country clubs (2.4%); resorts and resort hotels (1.9%); homeowners associations (1.3%); waterparks, and amusement and theme parks (1.1%); racquet and tennis clubs (0.5%): stadiums, arenas, and tracks (0.4%); military installations (0.4%); corporate recreation and sports centers (0.3%); churches (0.3%); and ice rinks (0.1%). Another 3.2% of respondents were with “other” types of facilities, including two bowling facilities, a sailing center, a few childcare centers, a couple of youth shelters, and a number of swim schools.
 The vast majority of respondents from parks (98.4%) and schools (88.1%) were with public or governmental organizations. Colleges and universities (58.1%) and rec centers (50.9%) were also more likely to be public or governmental than private organizations.
Respondents from Ys and camps were most likely to be working for private nonprofit organizations. Some 95.3% of Y respondents and 63.2% of camp respondents said they were with private nonprofit organizations.
Only health and fitness clubs were more likely to be private for-profit organizations, with 57.4% of these respondents indicating they worked for private for-profit organizations.
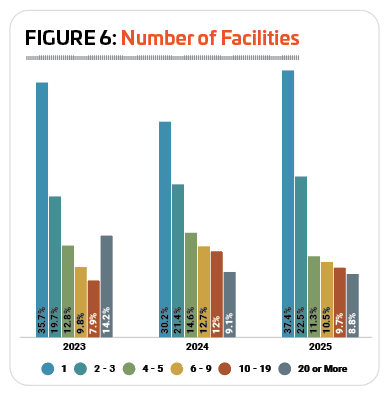
On average, respondents said they manage 8.5 separate facilities, up from 6.6 in 2024, but exactly the same (8.5) as in 2023. More respondents in 2025 said they manage just a single facility. While 30.2% of respondents in 2024 said they manage just a single facility, in 2025 37.4% of respondents manage just a single facility. Another 22.5% of respondents in 2025 said they manage just two or three individual facilities, and 11.3% manage four or five facilities. The number of respondents managing more than five facilities fell, with 10.5% managing between six and nine facilities (down from 12.7%), 9.7% managing between 10 and 19 facilities (down from 12%); and 8.8% managing 20 or more facilities (down from 9.1%). (See Figure 6.)
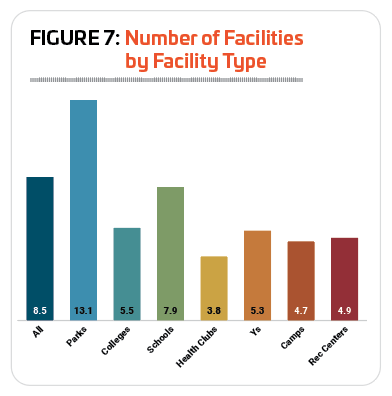 Park respondents had the greatest number of facilities to manage, with an average of 13.1, up from 9.4 in 2024, but right in line with the number from 2023, 13.3. They were followed by respondents from schools (7.9), colleges (5.5), and Ys (5.3). Respondents from health clubs (3.8) had the fewest individual facilities to manage. (See Figure 7.)
We often report on the usefulness of partnerships for recreation, sports, and fitness facilities. Partnering with other organizations in the community can help provide a wider array of programming opportunities, can help with budgeting, and can expand the types of amenities and offerings provided for visitors and members. The majority of respondents in 2025—87.2%—said they had formed such partnerships with other organizations, up from 85.4% in 2024, and 84.4% in 2023.
Local schools were the most common type of partner for all types of facilities. Six in 10 (60%) respondents said they had partnered with local schools, representing no change from 2024 (59.9%). The next most common types of partners included: local government (51.5% of respondents had partnered with local government, up from 47.4% in 2024); nonprofit organizations (48.5%, down from 55.6%); colleges and universities (36.3%, down from 37.1); and state government (34.4%, up from 21.1%). (See Figure 8).
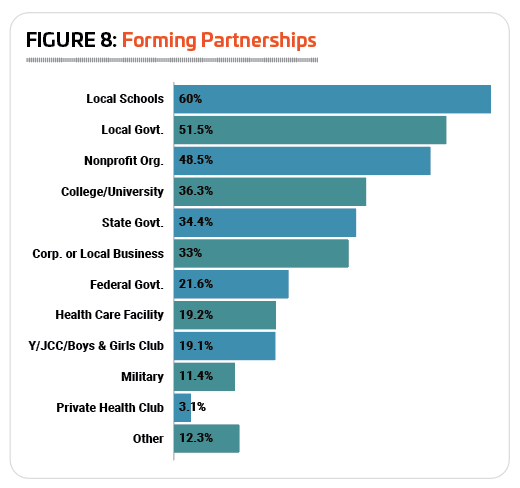 There was a significant drop in the number of respondents indicating they had partnered with corporations or local businesses, down from 46.7% in 2024 to 33% in 2025. At the same time, the number of respondents partnering with the federal government was up from 15.3% in 2024 to 21.6% in 2025.
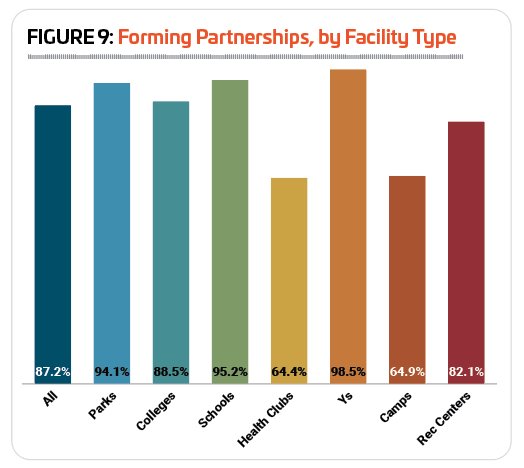
Respondents from Ys, schools, and parks were the most likely to report that they had partnered with other organizations. Some 98.5% of Y respondents, 95.2% of school respondents, and 94.1% of park respondents said they had formed partnerships with other organizations. Respondents from health clubs and camp facilities were the least likely to form partnerships, though a majority (64.4% and 64.9%, respectively) said they had done so. (See Figure 9.)
As is generally the case, Ys were not only the most likely to form partnerships, but also the most likely to partner with most of the different types of organizations listed in the survey. Ys were the most likely to partner with local schools (81%), nonprofit organizations (79.6%), other Ys (68.6%), corporations or local businesses (57.7%), health care or medical facilities (55.5%), state government (53.3%), the federal government (40.9%), and the military (33.6%).
The only exceptions were for local government, colleges and universities, and private health clubs. Park respondents were the most likely to report that they had formed partnerships with local government (69.8%). Colleges and universities were the most likely to have partnered with other colleges and universities (71%). And rec centers were the most likely to have partnered with private health clubs, though only 5.3% said they had formed such a partnership.
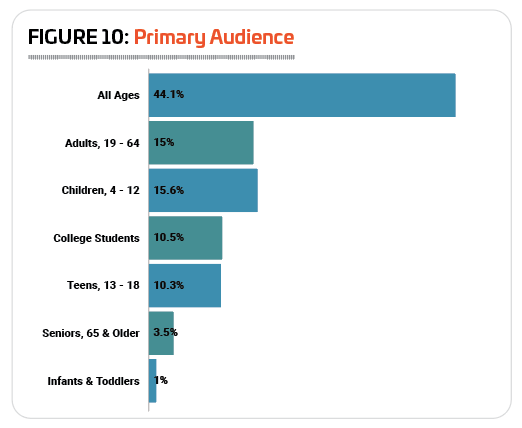
 Asked about the typical age range for their facilities’ audience, respondents were most likely to report that they reach all ages. Some 44.1% of respondents said their facilities reach all ages, down from 48.2% in 2024. Another 15.6% of respondents said they primarily reach children ages 4 to 12 (up from 14.9%), while 15% work with adults (down from 16.9%). More than one in 10 (10.5%) respondents said they primarily reach college students, and a similar number (10.3%) primarily reach teenagers. Much smaller numbers of respondents primarily serve seniors (3.5%) or infants and toddlers (1%). (See Figure 10.)
Respondents from Ys and parks were the most likely to report that their primary audience was made up of all ages. Some 63.5% of Y respondents and 58.3% of park respondents said they served all ages at their facilities.
Children ages 4 to 12 were most likely to be the primary audience for camps, where 25% of respondents said they primarily reach this age group. Adults were most likely to be the primary audience for health clubs, where 50% of respondents said they primarily serve adults. Respondents from schools were the most likely to name teens as their primary audience, with 61.7% of respondents indicating they primarily reached teenagers. College students were the most likely to be the primary audience at colleges and universities (no surprise there!), with 85.2% of college respondents indicating they primarily reach this age group. Health club respondents were more likely than others to report that they reached seniors, with 8.3% indicating this was their primary audience. Finally, school respondents were more likely than others to indicate that they primarily reached infants and toddlers, with 3% reporting this as their primary audience.
Let’s Talk Money
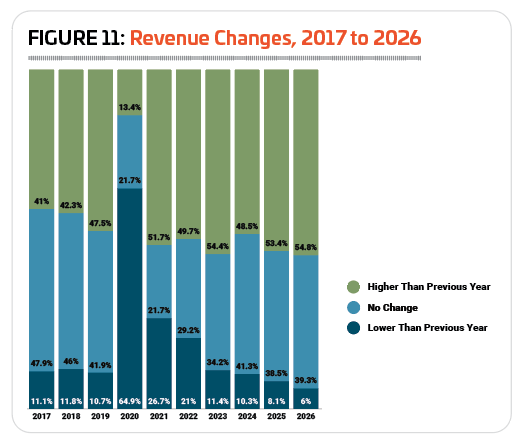
 In 2024, respondents generally saw continued improvement in their revenues, with fewer respondents reporting a decrease in revenues (just 10.3%) than at any point since 2007, when just over 5% reported a decrease in revenue. That said, fewer respondents saw their revenues increase in 2024 than in 2023, with 48.5% reporting an increase in 2024, compared with 54.4% who saw an increase in 2023. Another 41.3% of respondents said their revenues remained the same in 2024. (See Figure 11.)
Looking ahead, respondents had relatively optimistic revenue expectations for 2025 and 2026, with 53.4% anticipating an increase in their revenues in 2025, and 54.8% expecting an increase in 2026. (It is worth noting, though, that the majority of responses to this year’s survey were collected before March 2025, and the more recent decline in the U.S. Index of Consumer Sentiment is therefore not reflected here.)
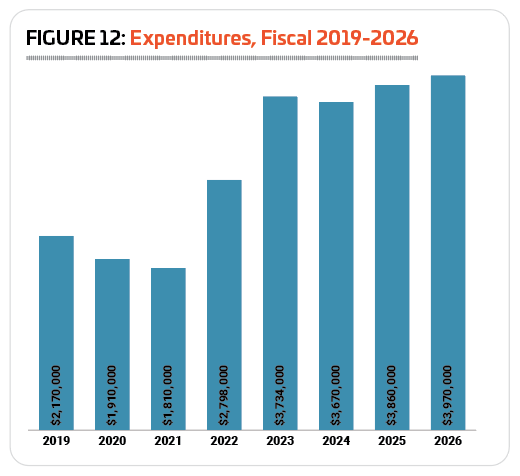
After reporting a significant 33.5% increase in average operating expenses from 2022 to 2023, this year’s respondents reported a very slight decrease of just 1.7% to their annual operating expenses. In 2023, respondents reported an average operating expense of $3,734,000, and in 2024, average expenses were $3,670,000. (See Figure 12.)
 In 2025, respondents are expecting their average operating cost to increase by 5.2% to $3,860,000. And in 2026, they expect a further increase of 2.8%, to $3,970,000.
Respondents from urban communities reported much higher costs than those from suburban and rural communities in 2024. Urban respondents saw an average operating expense of $6,530,000 in 2024, 75% more than suburban respondents, with an average of $3,740,000, and 244% more than rural respondents, with an average of $1,900,000.
Urban respondents also reported a significant increase in their average operating expense from 2023 to 2024, while those in suburban and rural areas reported decreases. For urban respondents, the average operating cost jumped 46.4% from $4,459,000 in 2023 to $6,530,000 in 2024. Suburban respondents reported a 21.6% decrease, from $4,769,000 to $3,740,000, while rural respondents reported a much smaller decrease of 2.1%, from $1,941,000 to $1,900,000.
Looking forward, respondents from all community types are anticipating increases to their average operating costs over the next two years, with the greatest percentage increase reported by rural respondents. Rural respondents are expecting their average operating cost to rise 15.3%, to $2,190,000, from 2024 to 2026. They were followed by urban respondents, who are anticipating a 6.9% increase, to an average of $6,980,000; and suburban respondents, who expect their average operating cost to increase by 4.5% between 2024 and 2026, to $3,910,000.
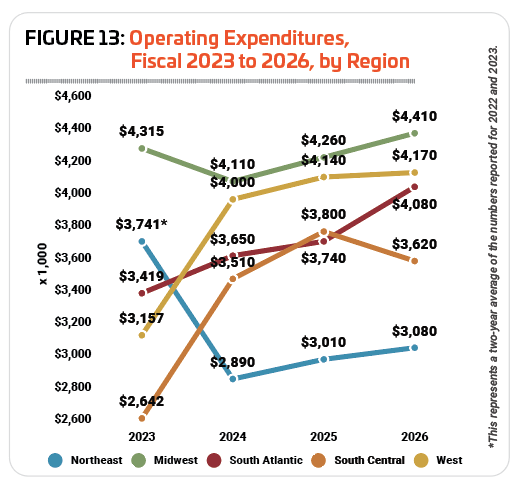
 In 2024, respondents from the Midwest and West reported the highest average operating expenses, but while Midwestern respondents saw their average cost decrease by 4.8% from 2023 to 2024, Western respondents reported a 26.7% increase. Midwestern respondents in 2024 spent an average of $4,110,000 on their operating costs, down from $4,315,000 in 2023. Western respondents spent an average of $4,000,000 in 2024, up from $3,157,000 in 2023. Respondents in the South Central region reported the greatest overall increase to their average operating cost, with a 32.9% increase from an average of $2,641,000 in 2023 to $3,510,000 in 2024. The South Atlantic region saw a more modest 6.8% increase, from $3,419,000 in 2023 to $3,650,000 in 2024. Respondents in the Northeast also reported a decrease, down 22.7% from a 2022-2023 average cost of $3,741,000 to $2,890,000 in 2024. (Because the Northeastern region’s reported costs in 2022 and 2023 were extremely volatile, we calculated an average for the two-year span to get a more representative number.) (See Figure 13.)
Looking forward, respondents in the South Atlantic region were expecting the greatest increase to their operating costs from 2024 to 2026, while those in the South Central region were anticipating the smallest increase. South Atlantic respondents are anticipating an 11.8% jump from 2024, to an average cost of $4,080,000 in 2026. They were followed by respondents in the Midwest, who are expecting operating costs to climb 7.3% from 2024 to an average of $4,410,000 in 2026. Northeastern respondents projected a 6.6% increase from 2024 to an average of $3,080,000 in 2026, while Western respondents projected a 4.3% increase from 2024 to an average of $4,170,000. Finally, respondents in the South Central region are expecting their average operating cost to increase by just 3.1% from 2024 to $3,620,000 in 2026.
 There was a great deal of variation in the average operating costs reported by different facility types, with numbers swinging wildly from 2023 to 2024. On one end of the spectrum, for example, health clubs reported a 257.3% higher average cost in 2024 than in 2023, while the other end showed a 53.3% lower cost for rec centers.
Respondents from schools and school districts reported the highest overall average operating cost for the year 2024, at $5,670,000, which was a 72.9% increase over the number reported for 2023, $3,279,000. They were followed by Ys, with an average cost of $5,290,000 in 2024, down 1.4% from $5,363,000 in 2023. Park respondents reported an average operating cost of $3,650,000 in 2024, up 1.5% from $3,597,000 in 2023. College respondents saw an average operating cost of $3,530,000 in 2024, down 47.8% from the average of $6,763,000 reported for 2023. Health club respondents reported that their average operating cost for 2024 was $2,340,000, up 257.3% from $655,000. Respondents from rec centers saw an average operating cost of $2,090,000 for 2024, down 53.3% from $4,475,000 in 2023. And finally, camps reported the lowest average operating cost in 2024, at $1,130,000, which is a 32.1% decrease from 2023, when camps had an average operating cost of $1,664,000. (See Figure 14.)
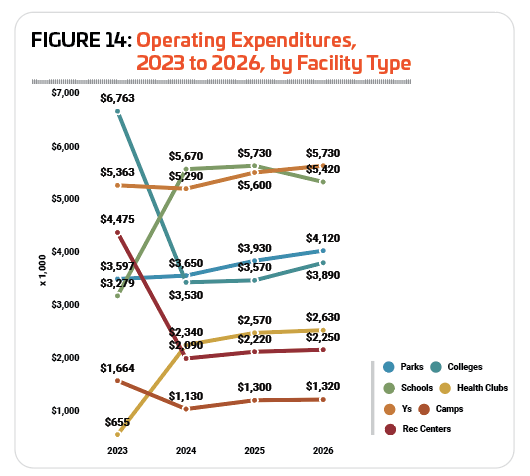 Looking forward, respondents from camps expect the largest increase to their average operating cost between 2024 and 2026, predicting they would increase 16.8% to $1,320,000. They were followed by park respondents, who projected a 12.9% increase from 2024 to an average operating cost of $4,120,000 in 2026. Health club respondents are expecting their average cost to increase 12.4% from 2024 to an average of $2,630,000 in 2026. Respondents from colleges projected a 10.2% increase over the next two years, to an average cost of $3,890,000 in 2026. Rec center respondents are expecting a 7.7% increase to an average of $2,250,000 in 2026, and Y respondents expected the smallest increase, anticipating that their average cost would rise 1.5% to $5,370,000 in 2026. Only school respondents are expecting their operating costs to decrease over the next two years, projecting a 4.4% drop to an average of $5,420,000 in 2026.
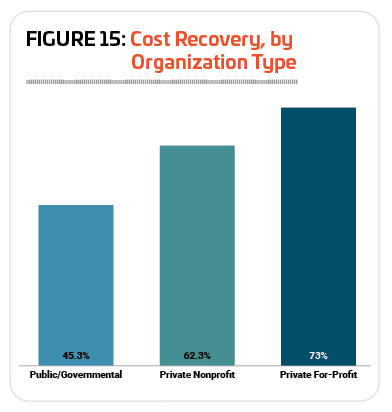
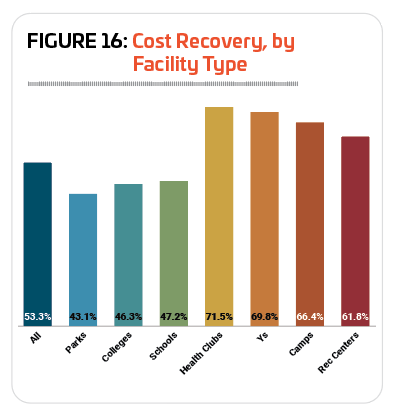
On average, respondents in 2025 said they recover 53.3% of their operating costs via revenues, down from 61.5% in 2024. As one would expect, private, for-profit organizations reported the highest rate of cost recovery, at 73%, down from 83% in 2024. They were followed by private nonprofits, which recovered an average of 62.3% of their costs via revenues, down from 71.8%. And finally, public/governmental organizations reported a cost recovery rate of 45.3%, down from 53.5%. (See Figure 15.)
 Given their nature, it follows that those types of facilities more likely to be for-profit are able to earn back a greater portion of their facility costs via the revenues they bring in, and this is indeed the case, with health club respondents reporting the highest rate of cost recovery, at 71.5%. They were followed by Ys (69.8%), camps (66.4%), and rec centers (61.8%). At the other end of the spectrum, respondents from parks (43.1%), colleges (46.3%), and schools (47.2%) all reported cost recovery rates of less than 50%. (See Figure 16.)
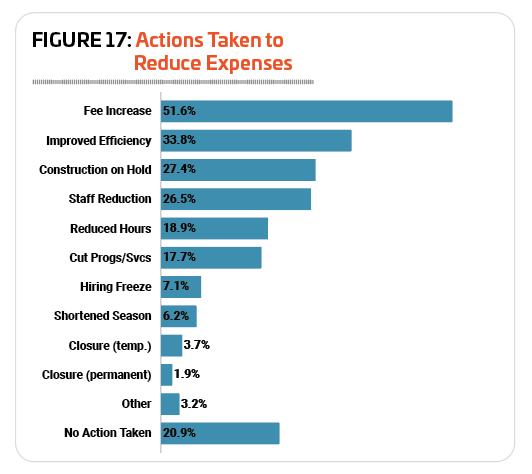
Slightly fewer respondents in 2025 reported that they had taken action of some kind to lower the operating costs at their facilities. In 2025, 79.1% of respondents said they had taken such action, down from 83.2% in 2024, and 83.3% in 2023. The most common measure respondents had taken to improve their bottom line was a fee increase. Some 51.6% of respondents in 2025 said they had increased their fees, up just slightly from 50.7% in 2024. More than one-quarter of respondents in 2025 said they had: improved energy efficiency (33.8%, down from 38.7% in 2024); put construction or renovation plans on hold (27.4%, down from 34.2%); or made reductions in staff (26.5%, down from 27.8%). (See Figure 17.)
In 2025, respondents from camps and Ys were the most likely to report that they had taken action to reduce their operating expenditures. Some 90.6% of camp respondents and 89.1% of y respondents said they had taken such measures. They were followed by respondents from health clubs (82.9%), colleges (80.2%), parks (80.1%), and rec centers (76.5%). Respondents from schools were the least likely to report that they had taken action to reduce their expenses, though a majority—60%—had done so.
 Respondents from camps were the most likely to take many different actions to reduce costs at their facilities, including increasing fees (75.5% of camp respondents said they had increased fees); improving energy efficiency (43.4%); putting construction or renovation plans on hold (34%); shortening their season of operation (11.3%); or temporarily closing facilities (7.5%).
Respondents from colleges and universities were the most likely to report that they had reduced their hours of operation (30.2%); or instituted a hiring freeze (12.1%).
Y respondents were the most likely to report that they had reduced their staff (42.9%) or cut programs and services (30.3%).
Finally, respondents from health clubs were the most likely to report that they had permanently closed a facility, though only 4.9% had done so.
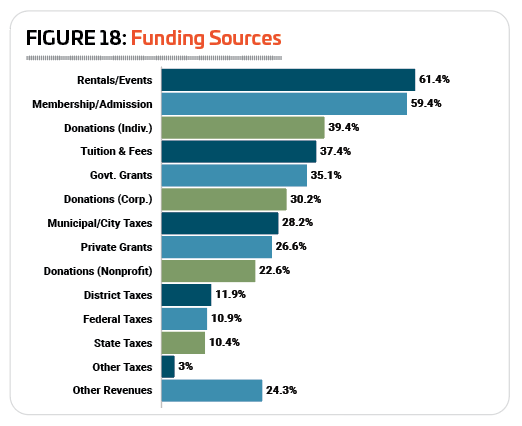
Asked about the primary sources of funding for their facilities, the most common included revenues from rentals and private events (61.4%), membership and admission fees (59.4%), and individual donations (39.4%). More than a quarter of respondents also said that they received funding from tuition and fees (37.4%), government grants (35.1%), corporate donations (30.2%), municipal or city taxes (28.2%), or private grants (26.6%). (See Figure 18.)
Membership & Visits
 Slightly fewer respondents in 2025 reported that they currently charge a fee for membership or for using their facilities. While 63.4% of respondents charged such a fee in 2024, in 2025, just 56.5% of respondents said they have membership or facility fees.
As usual, respondents from Ys and health clubs were the most likely to report that they currently charge a fee for membership or use of their facilities, with 92.8% of Y respondents and 89.6% of health club respondents indicating they do charge such a fee. More than two-thirds (69.1%) of rec center respondents charged a fee, and more than half of park respondents (53.4%) and college respondents (50.4%) charge a fee. Slightly less than half (46.7%) of camp respondents said they charge a fee. Respondents from schools were least likely to charge a fee for membership or for using their facilities, with just 20.5% indicating they do so.
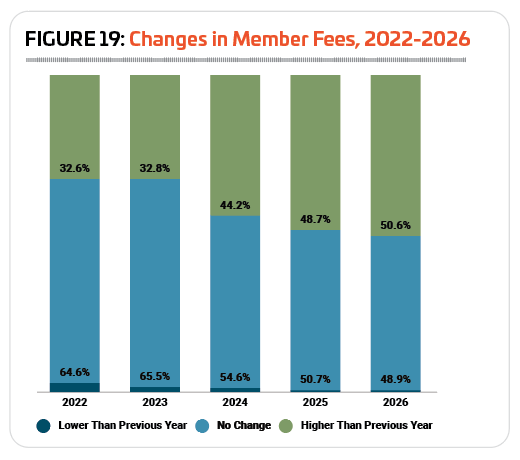
Respondents were much more likely to report that they had increased their fees in 2024 than in 2023. In 2023, just under one-third (32.8%) of respondents said they had increased their fees, while in 2024, 44.2% of respondents said they raised their fees. Another 54.6% of respondents said they had made no change to their fees in 2024, down from 65.5% who kept fees unchanged in 2023. Just 1.2% of respondents said they lowered their fees in 2024, about the same as in 2023 (1.7%).
(See Figure 19.)
 Looking forward, nearly half (48.7%) of respondents said they expect to increase their fees in 2025, while 50.7% will keep their fees unchanged. And in 2026, 50.6% of respondents are anticipating a fee increase, with 48.9% expecting no change.
Respondents from camps and Ys were the most likely to report that they had increased their membership or facility use fees in 2024. More than two-thirds (67.9%) of camp respondents and 61.4% of Y respondents said they had done so. They were followed by rec centers, where 45.3% of respondents had increased their fees in 2024. College respondents were the least likely to have increased their fees in 2024, with just 17.9% indicating they had done so.
Looking forward, respondents from camps, Ys, and health clubs were the most likely to indicate that they planned to increase their fees in 2025. Some 67.9% of camp respondents, 63.8% of Y respondents, and 64.3% of health club respondents said they were anticipating a fee increase in 2025. School respondents were the least likely to be planning a fee increase, with just 18.5% indicating they planned to do so.
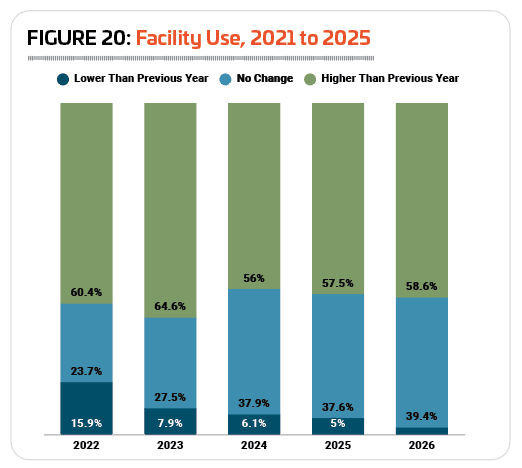
 In 2022 and 2023, more than six in 10 respondents saw the number of people using their facility increase. In 2024, that number feel to 56% of respondents reporting an increase in the number of people using their facilities. Another 37.9% said there was no change to the number of people using their facilities from 2023 to 2024, and 6.1% reported a decrease. (See Figure 20.)
Looking forward, nearly six in 10 respondents said they are expecting the number of people using their facilities to increase in 2025 (57.5%) and in 2026 (58.6%). Just 5% of respondents expect usage of their facilities to decline in 2025, and 2% are expecting a decrease in 2026.
Respondents from Ys and parks were the most likely to report that the number of people using their facilities increased from 2023 to 2024. Some 74.1% of Y respondents and 64.8% of park respondents said the number of people using their facilities increased in 2024. Respondents from schools (31.5%) and colleges (43.6%) were the least likely to report that the number of people using their facilities increased in 2026.
Looking forward, respondents from Ys were also the most likely to expect further increases in the number of people using their facilities in 2025 and 2026. Some 75% of Y respondents said they expect facility usage to rise in 2025, and 78.3% are anticipating further increases in 2026.
Staff & Expertise
 As mentioned, respondents to the report have a great deal of experience in the industry (more than 23 years), as well as in their current roles (more than 12 years), which are largely decision-making positions. But it’s a rare person who does the work alone. On average, respondents have nearly 21 (20.7) people reporting directly to them, and their organizations employ an average of 214.1 people, up slightly from 205.7 in 2024. This includes an average of 38.8 full-time employees (down from 41.8), 64 part-time employees (up from 53.9), 52.9 seasonal employees (up from 49.5), 52.4 volunteers (down from 60.5), and six “others.”
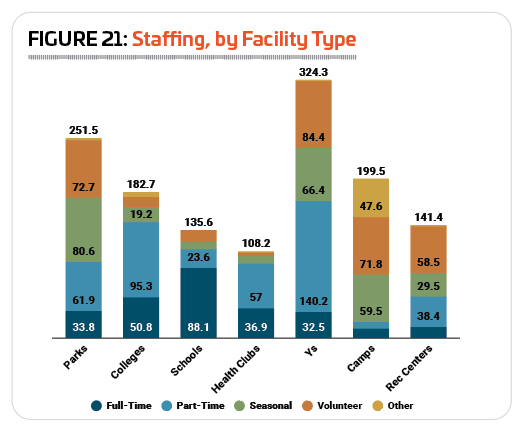
As usual, Ys employed the largest number of people, with an average of 324.3 employees of all kinds, down from 391 in 2024. This includes 32.5 full-time employees, 140.2 part-time employees, 66.4 seasonal employees, 84.4 volunteers, and 0.8 “others.” They were followed by parks, with an average of 251.5 employees (33.8 full-time, 61.9 part-time, 80.6 seasonal, 72.7 volunteer, and 2.5 “other” employees), and camps, with an average of 199.5 employees (11.2 full-time, 9.4 part-time, 59.5 seasonal, 71.8 volunteer, and 47.6 “other” employees). Health club respondents had the smallest average number of employees, at 108.2 (36.9 full-time, 57 part-time, 9.2 seasonal, four volunteer, and 1.1 “other” employees). (See Figure 21.)
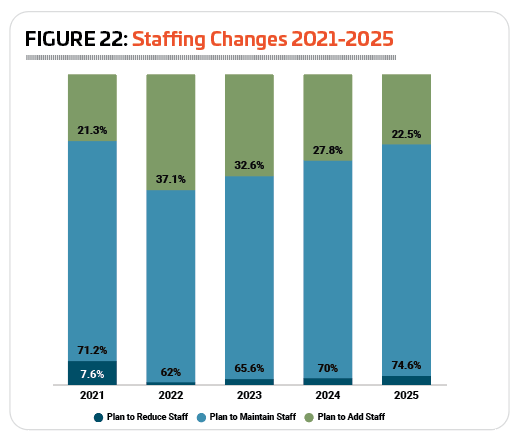
 Nearly three-quarters (74.6%) of respondents in 2025 said they plan to maintain their existing staffing levels this year, up from 70% in 2024. Another 22.5% were planning to add staff—the smallest number since 2021, when 21.3% of respondents planned to add staff. Just 3% of respondents in 2025 said they were planning to reduce staff at their facilities this year. (See Figure 22.)
The employees and volunteers working to bring recreation, sports, fitness, and aquatic experiences to their members and visitors have myriad roles and skills, and, as in many other fields, certifications provide a way for professionals in a variety of careers to prove not only that they know their stuff, but also that they are staying on top of the latest advances and developments in their field. Certifications validate knowledge and skill for a range of jobs related to the field, from lifeguards and aquatic facility managers to park district directors, personal trainers, early childcare education specialists and more.
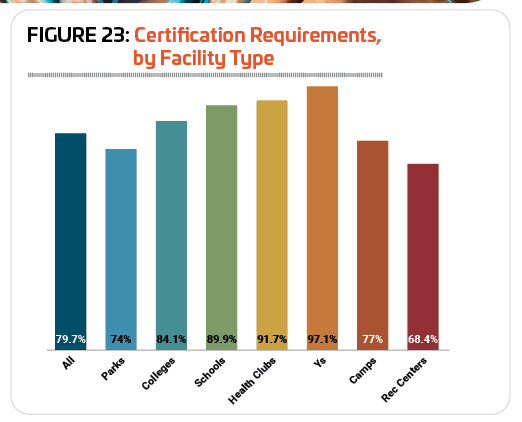
In 2025, 79.7% of respondents said they currently require certification of some kind for at least some of their staff members, up slightly from 78.7% in 2024 and 76.9% in 2023.
 Respondents from Ys, health clubs, and schools were the most likely to require certifications for some of their staff members. Some 97.1% of Y respondents said they currently require certifications, down slightly from 98.1%. They were followed by health clubs (91.7%, up from 78%), schools (89.9%, down from 100%), and colleges (84.1%, down from 86.6%). Fewer respondents from camps (77%) and parks (74%) said they require certification for staff members. Respondents from rec centers were the least likely to require any staff members to hold certifications, though nearly seven in 10 (68.4%) did so. (See Figure 23.)
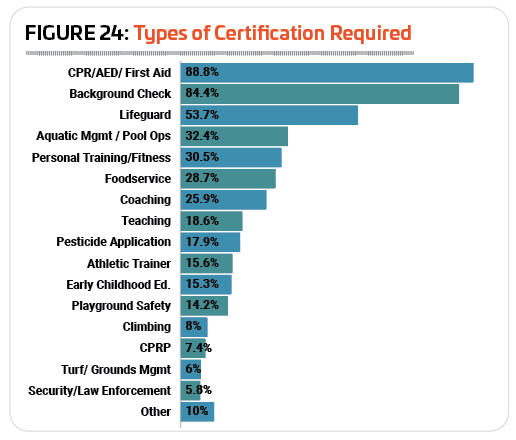
As always, the most commonly required certification is CPR/AED/First Aid training. A majority—88.8%—of the respondents who require any certifications said they ask at least some staff members to be certified in CPR, AED use and First Aid, down just slightly from 89.4%, but still up from 2023, when 85.3% required this training. Background checks are also a common method for respondents to verify the credentials of their staff, with 84.4% of respondents who require any certifications doing background checks, up significantly from 2024, when 69.3% of respondents required background checks. Lifeguard certifications were required by 53.7%, and aquatic management certifications were required by 32.4% of respondents, down from 60.9% and 40.5%, respectively. (See Figure 24.)
 There was an increase in the number of respondents who require coaching certification (15.2% in 2024 to 25.9% in 2025), teaching certification (12% to 18.6%), athletic training certification (12.3% to 15.6%), and early childhood education certification (12.3% to 15.3%), likely explained by the higher representation of respondents from schools and school districts in this year’s survey population.
Different types of facilities require different types of knowledge and skills, and so obviously, some kinds of certifications are more likely to be required depending on the needs of the facility—the programming it offers, the amenities it includes, and so on. Respondents whose facilities include swimming pools or other aquatic features are much more likely to require lifeguard certification (85.9%, vs. 53.7% of all respondents) or aquatic management certifications (53.7% vs. 32.4%). Respondents from parks were more likely than others to require pesticide application certification (31.5%), playground safety certification (32.8%), the Certified Parks & Recreation Professional (CPRP) certification offered through the National Recreation and Park Association (19.9%), or turf and grounds management certification (10%). Respondents from health clubs were more likely than anyone else to require personal trainer certification (84.1%). Camp respondents were the most likely to require foodservice certification (68.1%), or climbing certification (38.3%). Respondents from schools were the most likely to require teaching certification (73.2%), coaching certification (68.3%), or security/law enforcement certification (17.9%). Athletic trainer certifications were most common for college respondents (35.3%). Childcare and early childhood education certification was most commonly required by respondents from Ys (50.7%).
Facility Construction & Amenities
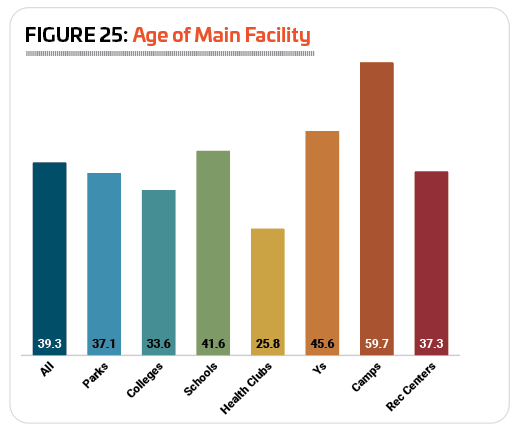
 For the second year in a row, respondents’ flagship facilities are not older, on average, than the previous year. In 2025, respondents’ flagship facilities averaged 39.3 years, down from 41 years in 2024, and 43.7 years in 2023. (See Figure 25.)
Just 4% of respondents said their flagship facility was 5 years old or less. Another 12.1% had facilities that were between 6 and 10 years old. Some 17.4% said their flagship facility was between 11 and 20 years old. More than one-fifth (20.8%), had facilities between 21 and 30 years old, while 10.5% had facilities between 31 and 40 years old, and 12.9% had facilities between 41 and 50 years old. Nearly three out of 10 (29.3%) respondents said their flagship facility was more than 50 years old.
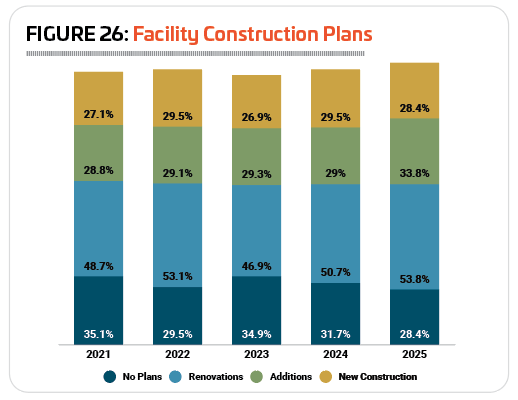
More than seven in 10 (71.6%) respondents in 2025 said they have plans for new construction, additions, or renovations at their facilities over the next few years, up from 68.3% in 2024, and 65.1% in 2023. In 2025, more than half (53.8%) of respondents said they are planning renovations, up from 50.7% in 2024. Another third (33.8%) were planning additions at their facilities, up from 29%. And 28.4% of respondents said they were planning new construction, down slightly from 29.5% in 2024. (See Figure 26.)
 Respondents from parks were the most likely to report in 2025 that they are planning construction of any kind within the next three years. Some 81.2% of park respondents said they have such plans, up from 74.6% in 2024. They were followed by Ys, where 79.1% of respondents in 2025 are planning construction, up just slightly from 78.7%; and camps, where 77.2% of respondents are planning construction, down from 85.4% in 2024. Around two-thirds of respondents from rec centers (67%) and colleges (65.1%) in 2025 said they were planning construction, up from 60.2% and 60%, respectively. Respondents from schools (57.5%) and health clubs (55.6%) were the least likely to be planning construction, up from 45.8% and 33.3%, respectively.
Respondents from parks and camps were the most likely to be planning new construction. Some 38.6% of respondents in each cohort indicated that they had plans for new construction. They were followed by colleges (24%) and Ys (23.9%).
Camps were the most likely to be planning additions to their existing facilities. Nearly half (49.1%) of camp respondents said they had such plans. They were followed by respondents from Ys (40.3%) and parks (36.6%).
Respondents from parks, Ys, and camps were the most likely to be planning renovations to their existing facilities. Some 61.4% of park respondents, 59.7% of Y respondents, and 59.6% of camp respondents said they were planning renovations. They were followed by colleges (51.2%), and rec centers (48.4%).
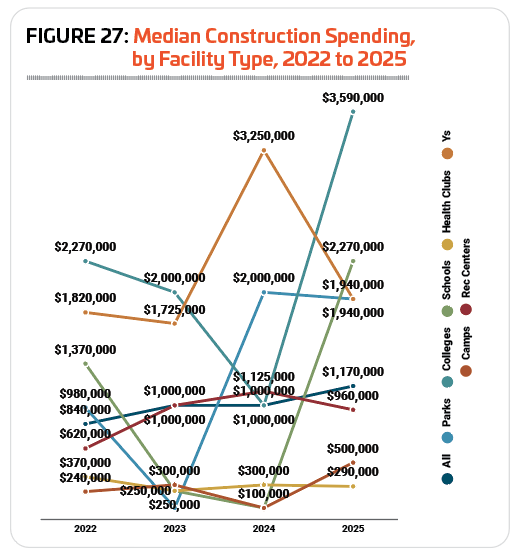
In 2025, the median amount planned for construction spending is $1,170,000, 17% higher than in 2024, when the median construction cost was $1 million. The highest construction budgets in 2025 were reported by respondents from colleges and universities, planning to spend $3,590,000. They were followed by schools ($2,270,000), and parks and Ys ($1,940,000). Respondents from health clubs and camps had the lowest median construction cost in 2025, at $290,000 and $500,000, respectively. (See Figure 27.)
When considered by region, respondents in the West generally report the highest construction budgets, and 2025 is no exception. The region’s median construction spending in 2025 was $2,500,000, up from $2 million in 2024. They were followed by the South Central region, with a median construction cost of $2,120,000 in 2025, up from $1 million in 2024, and the South Atlantic region, with a median construction cost $1,820,000, up from $950,000. Respondents in the Midwest and Northeast had the lowest median construction cost in 2025, with both cohorts reporting a median cost of $1,340,000, up from $1 million in 2024 for the Northeast, and down from $1,750,000 in 2024 for the Midwest. (See Figure 28.)
Various challenges can arise to impede construction plans, from increasing costs and budget shortfalls to supply chain disruptions and staffing shortfalls. In 2025, 78% of respondents reported that they had experienced at least one challenge or setback to their construction and renovation plans, down from 88.7% in 2024.
The biggest challenge or setback to construction plans for respondents to the 2025 Industry Report survey were budget shortfalls, with 54.8% of respondents indicating that budget shortfalls had had an impact on their construction plans. That said, this was down from 2024, when 61.1% of respondents faced budget shortfalls. The next most common challenges included: rising construction costs (43.6%, down from 68.2%); staffing shortages (17.2%, down from 33.2%); and supply chain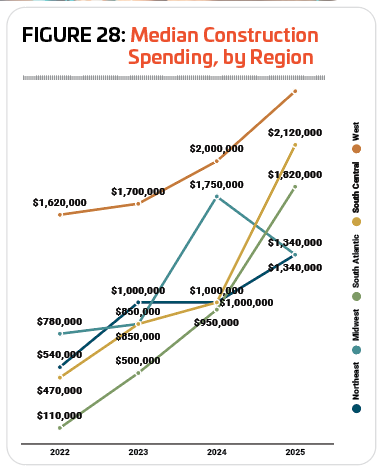 disruptions (13.8%, down from 30.5%). (See Figure 29.)
(Editor’s Note: The impact of the current presidential administration’s approach to tariffs on construction costs remains to be seen. It’s worth noting here the timing of this year’s survey, which was closed well before the announcement of significant tariff increases. An Associated Builders and Contractors Report from April 15, 2025, found that “respondents who completed the survey after the April 2 tariffs announcement were significantly less upbeat,” with more than 40% of those respondents anticipating a decline in their profit margins over the next six months. “Approximately 80% of ABC contractors surveyed indicate that suppliers have notified them of tariff-related materials price increases, and nearly 20% of contractors surveyed had projects paused or interrupted because of tariffs during March,” said ABC Chief Economist Abirban Basu in a press release. “These tariffs have already materially diminished the outlook for construction activity in 2025. Many businesses are poised to delay or even cancel planned capital investments given the current business environment and daily market convulsions. Conditions will likely deteriorate further if elevated tariff rates remain in place for any meaningful length of time.”)
The top amenities currently included in respondents’ facilities included: playgrounds (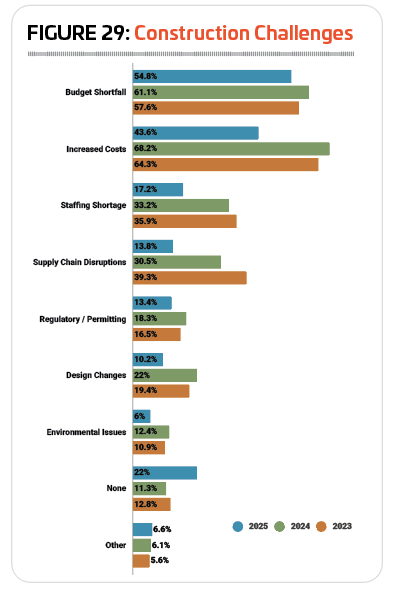 59.5% of all respondents said they have playgrounds); outdoor sports courts for basketball, tennis, pickleball, etc. (58.2%); bleachers and seating (57.5%); locker rooms (57.3%); indoor courts for sports like basketball, racquet sports, volleyball, etc. (57.3%); classrooms and meeting rooms (57.2%); fitness centers (54.7%); open spaces including gardens, natural areas, etc. (52.7%); natural turf sports fields for baseball, football, soccer, etc. (51.8%); and Wi-Fi services (51.8%). (See Figure 30.)
Most amenities saw either a decrease or no change in prevalence between 2024 and 2025. Those that saw an increase over the past year include indoor sports courts (up 7.6 percentage points), outdoor tracks (up 6.7 points), and fitness centers (up 4.2 points).
Respondents from parks were more likely than other respondents to include: playgrounds (86.7% of park respondents had playgrounds); park shelters (83.1%); park restroom structures (82.7%); open spaces like gardens and natural areas (77.2%); outdoor sports courts (75.3%); walking and hiking trails (73.6%); community or multipurpose centers (58.4%); bike trails (46.6%); splash play areas (42.6%); dog parks (42.2%); fitness trails and outdoor fitness equipment (40.1%); skateparks (38.8%); disc golf courses (34.6%); community gardens (32.7%); golf courses (17.7%); nature centers (16.9%); bike or BMX parks (12.9%); waterparks (11%); and ice rinks (11%).
College and university respondents were the most likely to include indoor sports courts (88.8%); locker rooms (88.8%); synthetic turf sports fields (58.4%); and indoor tracks (55.3%).
Respondents from schools and school districts were the most likely to include bleachers and seating (84.8%); concessions (72.8%); natur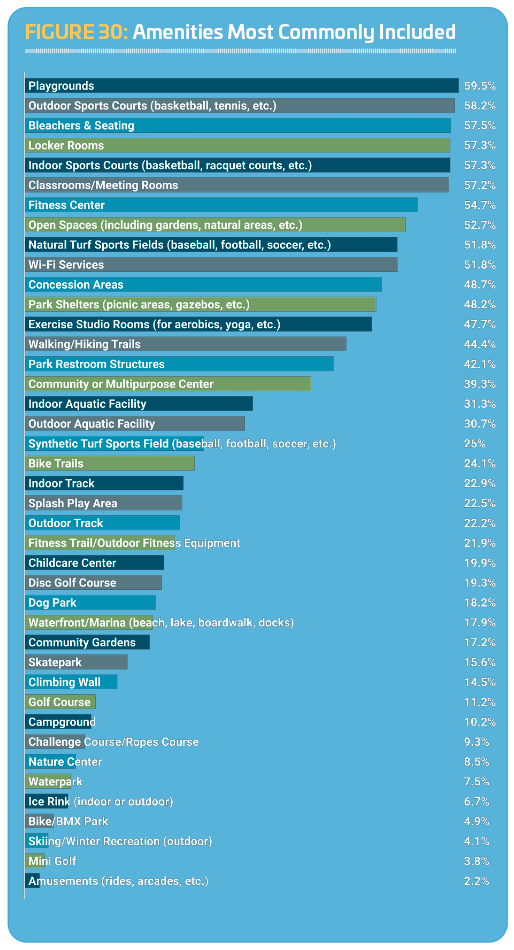 al turf sports fields (72.2%); and outdoor tracks (68.9%).
Health club respondents were more likely than others to include fitness centers (90.9%), and exercise studio rooms (81.8%).
Respondents from Ys were the most likely to include childcare centers (74.7%), indoor aquatic facilities (73.5%), and classrooms and meeting rooms (71.6%).
Finally, respondents from camps were more likely than other respondents to include: Wi-Fi services (74.2%); campgrounds (72.7%); waterfronts and marinas (56.1%); outdoor aquatic facilities (48.5%); challenge courses and ropes courses (37.9%); climbing walls (33.3%); miniature golf (21.2%); skiing and winter recreation (12.1%); and amusements such as arcades or rides (4.5%).
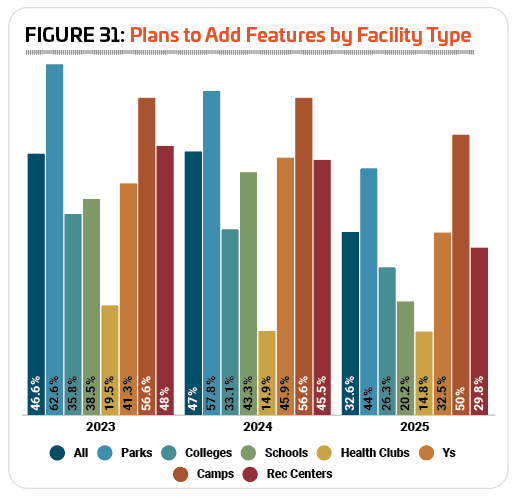
After climbing steadily from 2021 to 2024, the number of respondents in 2025 who are planning to add features at their facilities fell to 32.6%. That’s down from 47% in 2024, 46.6% in 2023, and 39.1% in 2022. (See Figure 31.)
In 2025, respondents from camps and parks were the most likely to be planning to add features at their facilities over the next few years. Some 50% of camp respondents said they had such plans, down from 56.6% in 2024, and 44% of park respondents had plans to add features, down from 57.8% in 2024. They were followed by Ys (32.5% had plans to add features, down from 45.9% in 2025), rec centers (29.8%, down from 45.5%), and colleges (26.3%, down from 33.1%). Around one-fifth (20.2%) of school respondents said they had plans to add features at their facilities, down from 43.3%. And, as last year, health club respondents were the least likely to be planning additional features at their facilities, with just 14.8% indicating they had such plans, virtually unchanged from 2024 (14.9%).
The top planned features in 2025 for all facility types include:
- Splash play areas (23.2% of respondents with plans to add features were planning to add splash play)
- Synthetic turf sports fields (19.1%)
- Playgrounds (17.4%)
- Park shelters (14.2%)
- Park restroom structures (13.5%)
- Outdoor sport courts (13.3%)
- Fitness trails and outdoor fitness equipment (12.5%)
- Dog parks (12%)
- Community center or multipurpose center (11.6%)
- Indoor sports courts (11.4%)
Trends in Programming
 The vast majority—96.9%—of respondents provide programming of one kind or another at their facilities. This is up slightly from 2024, when 95.2% of respondents offered programming. A full 100% of respondents from health clubs, Ys, and rec centers said they have programming at their facilities. Some 99% of park respondents, 98.3% of school respondents, 96.8% of college respondents, and 96.4% of camp respondents also said they offer programming at their facilities.
The 10 most common types of programs offered at respondents’ facilities in 2025 include: holiday events and other special events (63.1% of respondents host holiday activities and special events); day camps and summer camps (56.8%); group exercise programs (55.9%); fitness programs (55.6%); educational programs (55.4%); youth sports teams (52.7%); mind-body balance programs such as yoga, tai chi, or Pilates (47.9%); arts and crafts (46.4%); programs for active older adults (44.4%); and swimming programs (42.3%). (See Figure 32.)
There was no increase in the number of respondents offering any type of program covered by the survey. While some program types were offered by similar numbers of respondents to 2024, most saw decreases.
Respondents from Ys were the most likely to offer a number of different types of programs, including: holiday events and other special events (90.3%); day camps and summer camps (89.6%); group exercise programs (83.6%); educational programs (79.1%); mind-body balance programs such as yoga and tai chi (79.1%); programs for active older adults (77.6%); daycare or preschool (77.6%); swimming programs (74.6%); teen programming (73.9%); aquatic exercise programs (70.9%); individual sports activities such as running clubs (56.7%); special needs programs (54.5%); and adaptive sports (25.4%).
Park respondents were the most likely to host arts and crafts programs (64.3%), adult sports teams (54.2%), festivals and concerts (51.9%), sport training such as tennis or golf lessons (43.3%), and trips (41.5%).
Respondents from health clubs were the most likely to offer fitness programs (91.1%), functional fitness programs (82.2%), personal training (75.6%), nutrition and diet counseling (55.6%), and therapeutic programs (24.4%).
School respondents were more likely tha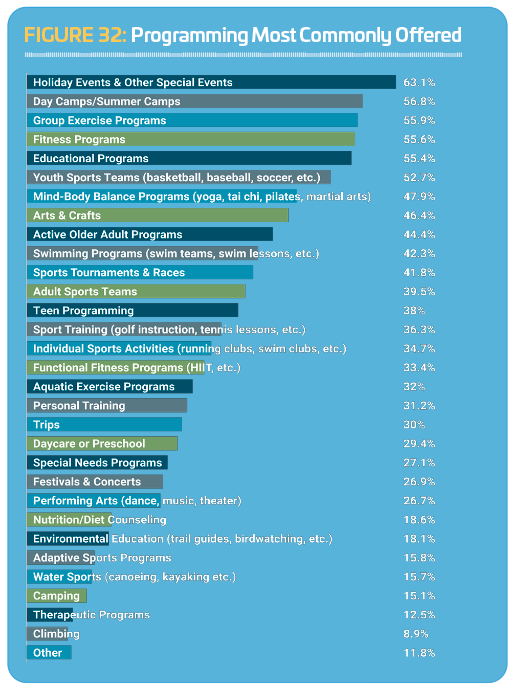 n others to offer youth sports teams (80.2%), sports tournaments and races (50.4%), and performing arts programs (38%).
Respondents from camps were the most likely to offer camping programs (64.3%), water sports like canoeing or kayaking (42.9%), and environmental education programs (32.1%).
College respondents were more likely than others to host climbing programs (22.4%).
Nearly one-quarter (24.7%) of respondents in 2025 said they were planning additional programming to their lineup over the next several years. This is down substantially from 2024, when 43.7% were planning to add programs, and is the smallest number planning to add programs in at least 15 years.
Respondents from Ys and parks were the most likely to report that they had plans to add programming options at their facilities. Around one-third of respondents from Ys (33.1%) and from parks (32.3%) said they were planning to expand their programming options. They were followed by rec centers (28.9%), health clubs (27.9%), and camps (22.1%). Respondents from colleges (17.2%) and schools (12.5%) were the least likely to have plans to expand their programming options.
The 10 most commonly planned program additions in 2025 were:
1. Fitness programs (planned by 24.6% of those who indicated they will expand their program options, up from 22.5% in 2024)
2. Adult sports teams (23.5%, up from 22.2%)
3. Teen programming (23.2%, up from 22.2%)
4. Group exercise programs (21.8%, up from 20.6%)
5. Mind-body balance programs (21.5%, down from 22.2%)
6. Functional fitness programs (20.1%, up from 18%)
7. Educational programs (19.8%, down from 24.1%)
8. Environmental education programs (19.3%, down from 26.4%)
9. Individual sports activities (19%, up from 15.8%)
10. Youth sports teams (17.6%, up from 14.1%)
In addition to formal program offerings, many recreation, sports, and fitness facilities get involved in a variety of initiatives in their communities, from improving health and wellness to resource conservation and connecting people with nature. More than three-quarter (79.9%) of respondents said they were involved in at least one of the initiatives covered by the survey.
Respondents from Ys were the most likely to be involved in such initiatives, with the vast majority—98.5%—indicating their facilities were involved in at least one of the initiatives listed on the survey. They were followed by respondents from parks (85%), rec centers (83.1%), and colleges (80.2%). Respondents from schools (63.5%), health clubs (74.4%), and camps (75%) were the least likely to be engaged in these initiatives.
The 10 most common initiatives for respondents to the 2025 Industry Report survey were:
1. Wellness initiatives (49.5%, down from 52.2% in 2024)
2. Outreach to underserved populations (46.4%, up from 37.1%)
3. Inclusion initiatives for those with physical disabilities (45.5%, virtually unchanged from 46%)
4. Outreach to economically disadvantaged populations (42.3%, up from 37.4%)
5. Inclusion initiatives for those with developmental disabilities (41.5%, down from 43.3%)
6. Outreach to minority populations (38%, up from 31.4%)
7. Programs to connect people with nature (26.3%, down from 33.6%)
8. Resource conservation and green initiatives (23.8%, up from 22.9%)
9. Initiatives to reduce hunger and improve nutrition (18.4%, down from 23.4%)
10. Disaster recovery assistance (11.6%, down from 30.4%)
Top Industry Challenges
 In the wake of the COVID pandemic’s most intense phase, staffing troubles became the predominant challenge for recreation, sports, fitness and aquatic facilities, with more than half of respondents naming it as the top industry challenge in 2022 (63.2%), 2023 (60%), and 2024 (55.5%). In 2025, staffing issues fell to the No. 2 spot, with equipment and facility maintenance concerns rising to the No. 1 position. Some 59.8% of respondents in 2025 said equipment and facility maintenance was a top challenge for the industry, up 7.2 percentage points from 52.6% in 2024; while 52.5% named staffing issues as a top challenge. (See Figure 33.)
Interestingly, staffing trouble was the only industry challenge covered by the survey that saw a decrease in 2025. All other challenges covered saw an increase in the number of respondents calling them a top concern.
While still named by a relatively small number of respondents—13.2%—legislative issues saw the greatest percentage-point increase from 2024 to 2025, from 5.5%.
The only other challenge that saw an increase of at least five percentage points from 2024 to 2025 was marketing and increasing participation, up 7.2 percentage points from 24.7% in 2024 to 31.9% in 2025.
Respondents from parks and rec centers were the most likely to name equipment and facility maintenance as a top concern, with 62.9% and 62.8%, respectively, indicating it’s a top industry challenge. They were followed by college respondents (62.4%) and camp respondent (61.2%). Asked to provide additional thoughts on their facility’s top challenge, many respondents referenced the challenges associated with deferred maintenance, and trying to address a backlog of projects in the face of limited funding and rising costs.
“Because it’s an old park,” one respondent wrote, “it’s an ongoing effort to keep facilities and structures updated and maintained. We usually pick one ‘big project’ each year and focus our energies (whatever staff time and funds we might have after the regular upkeep/maintenance that needs to be done daily and weekly) on that.”
Camp respondents were by far the most likely to name staffing issues as a top industry challenge. More than two-thirds (67.3%) of camp respondents said staffing was a top issue for the industry. They were followed by Ys (58.6%), and rec centers (55.1%).
“We hope to continue to grow our staff … to alleviate burnout (many hands make great work),” one respondent wrote. “The campers continue to have great experiences, but we want to make sure our foundation of the site and staff are also healthy.”
Marketing and increasing participation was most likely to be a top concern for respondents from health clubs, with 46.2% of these respondents indicating this was a top challenge. They were followed by camps (44.9%) and parks (38%).
Respondents from schools were the most likely to see legislative issues as a top industry challenge, with more than a quarter (27%) reporting that this was a top issue. They were followed by respondents from Ys (20.7%) and colleges (12.8%). RM
