


 Over the next 15 pages, we’ll look at how respondents from parks and recreation districts, departments, and related agencies responded to the Industry Report survey. Always capturing the largest portion of responses to the survey, in 2025, this cohort represents 34.5% of all respondents to the survey, down from 42.5% in 2024, but still higher than 2023, when 31.5% of respondents worked for parks and recreation organizations.
As usual, park respondents were most likely to be from the Midwest. Nearly one-third (31.8%) of park respondents said they were located in the Midwest. They were followed by the West (19.7%), Northeast (19.6%), and South Atlantic (17.3%) regions. The smallest number of park respondents in 2025, 11.6%, were located in the South Central region of the U.S.
Some 45% of park respondents were located in suburban communities. A little more than one-third (34%) were located in rural areas, and 20.9% said they were located in urban communities.
More than half of park respondents said they serve a population of less than 50,000 people. Some 17.6% reach a population of less than 10,000, while 44.4% reach a population of between 10,000 and 50,000 people. Another 12.9% reach a population of between 50,000 and 100,000, while 8.5% reach a population of 100,000 to 200,000, and 4.1% serve a population of 200,000 to 300,000. More than one in 10 (12.4%) park respondents said they serve a population of more than 300,000 people. The average population size for park respondents was 189,160, though the median was much smaller, at 29,470.
On average, park respondents manage 13.1 separate facilities, up from 9.3 in 2024, but similar to 2023’s results, when the average was 13.3. Nearly one-third (31.3%) of park respondents said they manage 10 or more facilities, down slightly from 33.6% in 2024. This compares with just 11.6% of non-park respondents who manage at least 10 individual facilities. At the other end of the spectrum, while around one-fifth (19%) of park respondents said they manage just a single facility, nearly half (47%) of non-park respondents manage just a single facility. Another 22.2% of park respondents said they manage two or three individual facilities, 13.5% manage four or five facilities, and 14.1% manage between six and nine facilities. (See Figure 46.)
Park respondents were most likely to reach all ages with their facilities, programs, and services, and were much more likely than non-park respondents to report that their audience was made up of all age groups. Some 58.3% of park respondents reached all ages, compared with 36.1% of non-park respondents. Another 23.6% of park respondents said they primarily worked with children ages 4 to 12, and 11.6% primarily reached adults. Much smaller numbers of park respondents primarily served an audience made up of senior (3.6%) 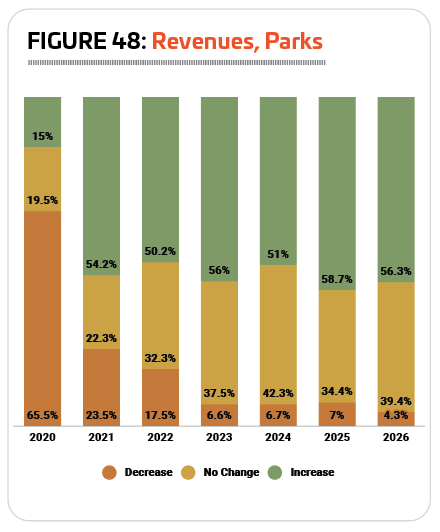 or teenagers (2.9%).
Park respondents were among those most likely to indicate that they had formed partnerships with other organizations. A majority of park respondents (94.1%) said they had partnered with other organizations, up from 92.9% in 2024. This compares with 83.3% of non-park organizations in 2025 who said they partner with other organizations.
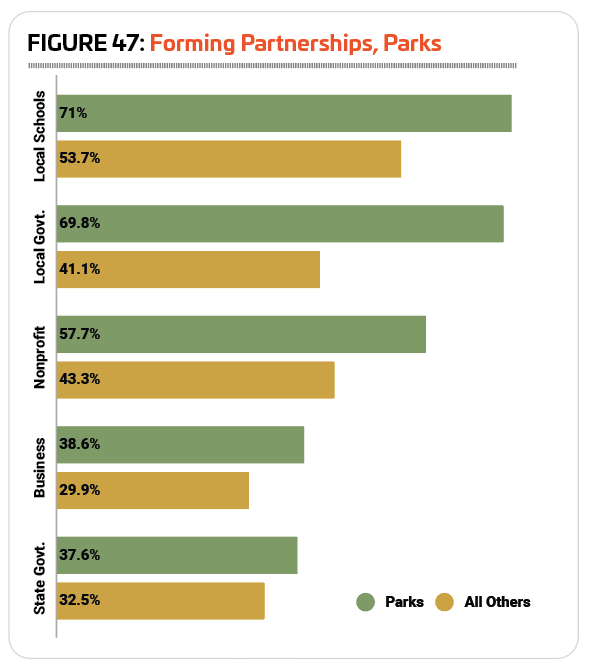
The most common partners for parks were local schools, with more than seven in 10 (71%) of park respondents indicating they had partnered with them, down from 74.7% in 2024. Nearly as many (69.8%) said they had partnered with local government, up from 65.7%. The next most common partners for park respondents were nonprofit organizations (57.7%, down from 69.4% in 2024), corporations and local businesses (38.6%, down from 57.1%), and state government (37.6%, up from 26.5%). (See Figure 47.)
Park Budgets & Costs
Revenues for park respondents have returned to normal after the challenging years of the COVID pandemic. More than half (51%) of park respondents said their revenues were higher in 2024 than in 2023, while 42.3% reported no change, and 6.7% reported a decrease. While this performance isn’t quite as positive as in 2023, when 56% saw an increase and just 6.6% reported a decrease, it still represents an improvement over the years 2020 through 2022. (See Figure 48.)
Looking forward, park respondents are expecting even better performance in 2025, with 58.7% projecting revenues will increase, 34.4% expecting no change, and 7% expecting a decrease. And in 2026, 56.3% of park respondents projected their revenues will increase, with 39.4% expecting no change, and just 4.3% anticipating a decrease.
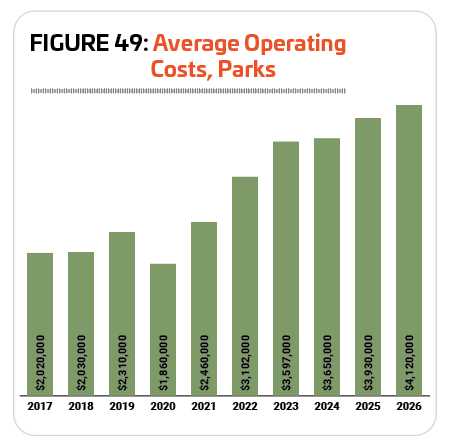
In 2024, park respondents spent an average of $3,650,000 on their operating expenses, a 1.5% increase from 2023’s average of $3,597,000. However, the median expenditure for park respondents in 2024 was just $880,000.
Looking forward, park respondents are expecting their average operating cost to increase another 7.7% in 2025, to $3,930,000, and a further 4.8% in 2026, to $4,120,000. If such projections were accurate, it would represent a 104% increase over 10 years, from $2,020,000 in 2017. (See Figure 49.)
On average, park respondents said they recover 43.1% of their operating costs via revenues, down from 51.6% in 2024. More than one-third (35.9%) of park respondents said they recover 30% or less, compared with 23.3% of non-park respondents. And while 40.6% of non-park respondents said they recover more than 70% of their operating costs via revenues, just 19.5% of park respondents recover at least 70% of their costs.
Facility rentals and private events represented the most common source of  funding for park respondents’ facilities. More than three-quarters (75.7%) of park respondents said their facilities received funding through rentals and private events, up from 73.5% in 2024, and much higher than non-park respondents (53.2%). The second most common funding source for park facilities in 2025 was membership and admission fees, with 60% of park respondents indicating they received funding from this source, compared with 59.1% of non-park respondents. Park respondents were much more likely than non-park respondents to receive funding via city or municipal taxes (57.7% vs. 11.4%) and government grants (52% vs. 25.5%). But the next most common funding method for parks—private donations from individuals—was more common for non-park respondents. While 36% of park respondents said they received funding through private individual donations, 41.4% of non-park respondents’ facilities were funded via these donations. (See Figure 50.)
More than eight out of 10 park respondents (80.1%) in 2025 said they had taken action over the past few years to reduce their operating costs. This is down slightly from 2024 (81.3%), and compares with 78.5% of non-park respondents in 2025 who had taken action to reduce their costs.
The most common methods park respondents relied on in 2025 to reduce their operating expenditures included: increasing fees (53.8% of park respondents had increased fees, down from 55% in 2024); improving energy efficiency (35%, down from 39.4%); putting construction or renovation plans on hold (30.3%, down from 34.7%); reducing staff (22.3%, down from 23.9%); and reducing their hours of operation (20.5%, down from 27.1%).
Park Facility Use & Constructi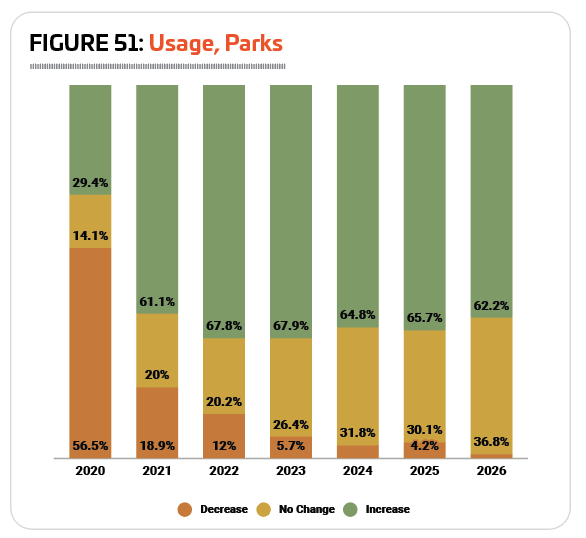 on Plans
Slightly fewer park respondents saw increasing numbers of people using their facilities in 2024 than in 2023. In 2024, 64.8% of park respondents said the number of people using their facilities had increased, down from 67.9% who reported an increase in 2023. Another 31.8% of park respondents said there was no change to the number of people using their facilities in 2024, and just 3.4% reported a decrease. (See Figure 51.)
Park respondents are expecting a similar situation for 2025, with 65.7% expecting usage of their facilities to increase, 30.1% expecting no change, and 4.2% expecting a decrease.
Looking forward, 62.2% of park respondents are expecting the number of people using their facilities to increase in 2026, while 36.8% anticipate no change, and just 1% are expecting a decrease.
Respondents from parks were more likely than any other group of respondents to report in 2025 that they have plans for construction over the next few years. Some 81.2% of park respondents are planning construction, compared with just 66.1% of non-park respondents. This is up from 2024, when 74.6% of park respondents were planning construction.
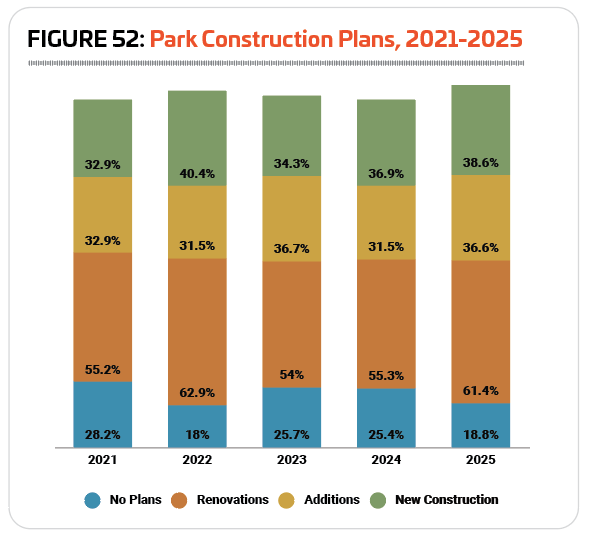
Park respondents were most likely to be planning renovations to their existing facilities. Some 61.4% of park respondents said they were planning renovations, up from 55.3% in 2024. Another 38.6% of park respondents were planning to build new facilities, up from 36.9% in 2024; and 36.6% were planning additions to their existing facilities, up from 31.5%. (See Figure 52.)
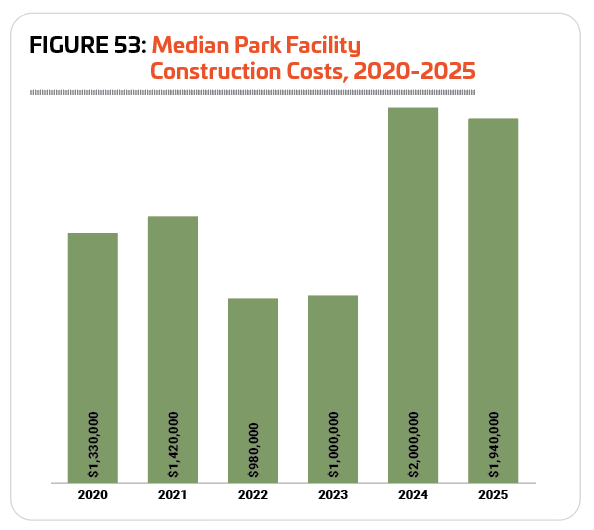
The median budget for construction spending on park facilities in 2025 was $1,940,000, a 3% decrease from 2024, when the median cost was $2 million. (See Figure 53.)
The most common features and amenities found in park respondents’ facilities in 2025 include: playgrounds (86.7% of park respondents had playgrounds, up from 83.9% in 2024); park shelters such as gazebos and picnic shelters (83.1%, down from 84.5%); park restroom structures (82.7%, up from 81.1%); open spaces such as gardens and natural areas (77.2%, up from 73.3%); outdoor sports courts for sports like basketball, tennis, or pickleball (75.3%, virtually unchanged from 75.1%); walking and hiking trails (73.6%, down from 75.4%); natural turf sports fields (70.7%, up from 68.7%); bleachers and seating (68.6%, down from 71.8%); classrooms and meeting rooms (58.4%, down from 66.1%); and community or multipurpose centers (58.4%, down from 60.6%).
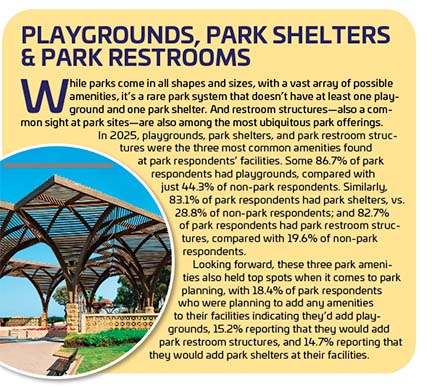
While park respondents were less likely in 2025 than in 2024 to have plans to add features at their facilities over the next few years, they were still among those most likely to be planning such additions, second only to camps. Some 44% of park respondents in 2025 said they were planning to add features at their facilities, down from 57.8% in 2024, and 62.6% in 2023. This compares with 26.5% of non-park respondents in 2025 who are planning such additions.
The most commonly planned additions for park respondents in 2025 include:
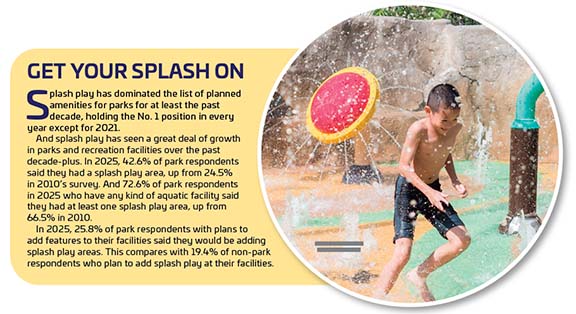
1. Splash play areas (planned by 25.8% of park respondents who will be adding features)
2. Dog parks (21.7%)
3. Synthetic turf sports fields (18.9%)
4. Playgrounds (18.4%)
5. Park restroom structures (15.2%)
6. Park shelters (14.7%)
7. Fitness trails or outdoor fitness equipment (13.4%)
8. Outdoor sports courts (12.9%)
9. Community or multipurpose center (12.9%)
10. Walking and hiking trails (12.4%)
Park Programming
Almost all park respondents—99%—said that they provide programming at their facilities. This is virtually unchanged from 98.7% in 2024, and compares with 95.7% of non-park respondents.
The most common programs found in park respondents’ facilities in 2025 include: holiday events and other special events (81% of park respondents’ offer this type of programming, down from 89% in 2024); youth sports teams (68.9%, down from 75.7%); day camps and summer camps (66.6%, down from 68.4%); arts and crafts programs (64.3%, down from 68.1%); educational programs (62.8%, down from 66.8%); programs for active older adults (61.5%, down from 62.8%); group exercise programs (60%, down from 64.8%); adult sports teams (54.2%, down from 56.5%); mind-body balance programs such as yoga and tai chi (53.7%, down from 54.5%); and fitness programs (52.2%, down from 57.1%).
Park respondents were much more likely than non-park respondents to indicate that they were planning to add to their program lineup over the next few years. Nearly one-third (32.3%) of park respondents in 2025 said they had such plans, down from 50.6% in 2024. This compares with 20.7% of non-park respondents.
The most commonly planned program additions for park respondents in 2025 include:
1. Fitness programs (up from No. 3)
2. Environmental education programs (down from No. 1)
3. Teen programs (up from No. 5)
4. Mind-body balance programs such as yoga and tai chi (no change from 2024)
5. Group exercise programs (up from No. 9)
6. Functional fitness programs (did not appear in the top 10 for parks in 2024)
7. Educational programs (down from No. 6)
8. Adult sport teams (down from No. 7)
9. Individual sports activities (did not appear in 2024)
10. Sport training, such as golf instruction or tennis lessons (did not appear in 2024)
Functional fitness programs, individual sports activities, and sport training replaced programs for active older adults, holiday events and other special events, and arts and crafts programs from 2024’s list of top planned programming additions.
Outreach & Other Initiatives
 Park respondents are involved in many different initiatives and outreach programs in their communities, from promoting inclusion for those with disabilities to reaching out to underserved populations, conserving resources, and more. Park respondents were much more likely than non-park respondents to have involvement in such initiatives. Some 85% of park respondents said they were involved in at least one of the initiatives covered in the survey, compared with 76.9% of non-park respondents.
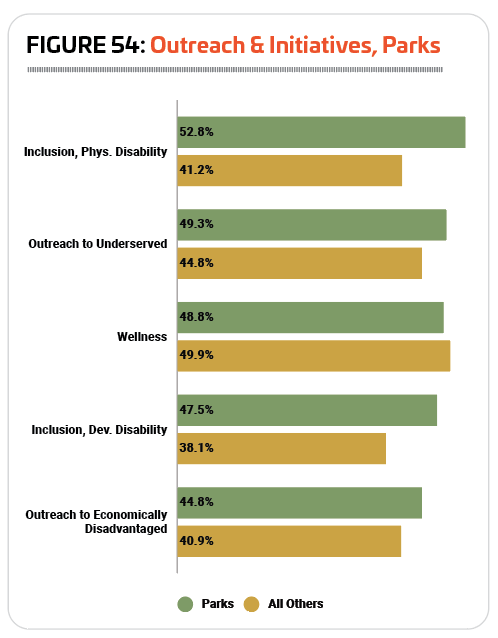
The most common initiatives for park respondents in 2025 were: inclusion initiatives for individuals with physical disabilities (52.8% of park respondents vs. 41.2% of non-park respondents); outreach to underserved populations (49.3% vs. 44.8%); wellness initiatives (48.8% vs. 49.9%); inclusion initiatives for individuals with developmental disabilities (47.5% vs. 38.1%); and outreach to economically disadvantaged populations (44.8% vs. 40.9%). (See Figure 54.)
Park respondents were also much more likely to be involved in most of the other types of initiatives covered by the survey, including: connecting people with nature (37.3% of park respondents had involvement, vs. 20% of non-park respondents); resource conservation and green initiatives (34.6% vs. 17.5%); disaster recovery assistance (15.3% vs. 9.5%); climate resilience initiatives (12.9% vs. 4.4%); and wildfire conservation initiatives (11.3% vs. 3.1%). RM
