


Over the next eight pages, we’ll learn more about the responses to the Industry Report survey from respondents who manage college and university recreation, sports, and fitness facilities. This group made up 13% of the total survey response in 2025, virtually unchanged from 2024 (13.1%).
College respondents were most likely to be from the Northeastern or Midwestern regions of the U.S. Some 26.9% of college respondents were located in the Northeast, and 24.4% were located in the Midwest. Another 19.3% of college respondents call the South Atlantic states home, with fewer reporting from the West (15.1%) or the South Central region (14.3%).
Respondents from colleges and universities were most likely to be located in suburban communities, with 42.9% indicating they called the suburbs home. Another 30.3% were located in urban communities, and 26.9% were located in rural areas.
The average population size served by college respondents in 2025 was 49,620, though the median was a much smaller number, 8,750, a bit higher than the average college size as reported by the U.S. News & World Report (about 6,400, according to data reported in January 2025).
 Some 58.1% of college respondents said they worked for public colleges and universities, down from 69.8% in 2024. Another 37.6% said they worked for private, nonprofit schools (up from 23%), while 3.8% worked for private, for-profit schools (down from 7.1%). And 0.5% of college respondents said they worked for “other” types of organizations.
On average, college respondents said they manage 5.5 individual facilities, up from two in 2024, but still below the number reported for 2023, 6.4. Some 56.5% of college respondents in 2025 said they manage between one and three individual facilities, compared with 60.2% of non-college respondents. However, non-college respondents were more than twice as likely as college respondents to manage 10 or more facilities. While 8.2% of college respondents said they had at least 10 separate facilities to manage, that number jumps to 19.9% for non-college respondents.
College and university respondents were slightly more likely than non-college respondents to report that they had partnered with other organizations. Some 88.5% of college respondents said they had partnered with other organizations, compared with 87% of non-college respondents. This represents an increase from 2024, when 82.6% of college respondents had formed partnerships.
College respondents were far more likely than non-college respondents to indicate that they had partnered with other colleges and universities—71% vs. 31.6%. The next most common partners for college respondents were: local schools (33.6% of college respondents had partnered with local schools); local government (28.2%); state government (28.2%); and nonprofit organizations (21.4%).
College & University Budgets & Costs
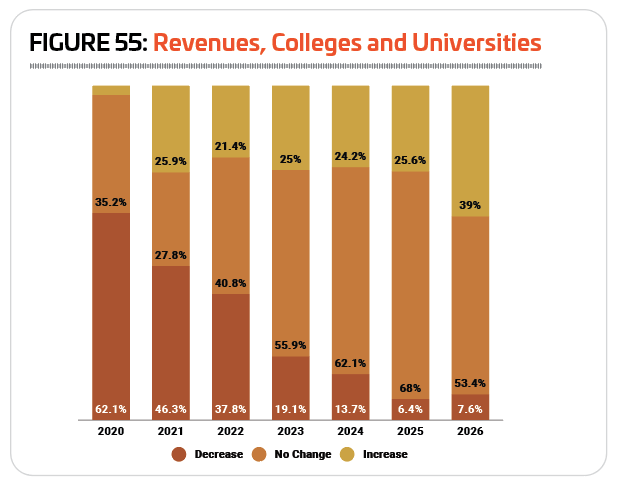
 The post-pandemic trend continues for colleges and universities, with revenues continuing to stabilize in 2024. In fact, while 62.1% of college respondents saw their revenues decrease in the year 2020, the same number—62.1%—said that their revenues remained unchanged from 2023 to 2024. Another 24.2% said their revenues increased from 2023 to 2024, and 13.7% saw a decline in their revenues. (See Figure 55.)
Even fewer college respondents said they expect revenues to decrease in 2025—just 6.4%. Most college respondents expect revenues to remain steady in 2025 (68%), while just over a quarter (25.6%) are anticipating a revenue increase.
Looking forward to 2026, 39% of college respondents are expecting an increase in revenues, with 53.4% anticipating no change, and 7.6% expecting a decrease.
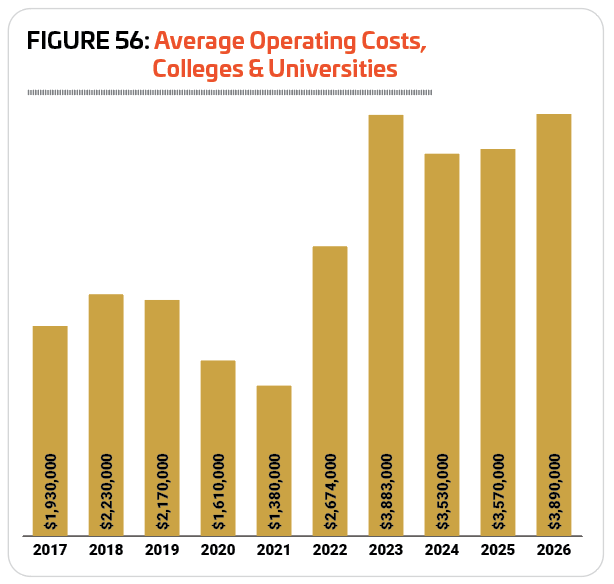
In 2024, college respondents spent an average of $3,530,000 on their operating expenses, 9.1% less than the adjusted average for 2023 of $3,883,000. (Averages for 2022 and 2023 have been adjusted to account for extreme outliers in the data set.) The median expenditure for college respondents in 2024 was $690,000.
Looking forward, college respondents are expecting their average operating cost to increase 1.1% in 2025, to $3,570,000, and a further 9% in 2026, to $3,890,000. If such projections were accurate, it would represent a 101.6% increase over 10 years, from $1,930,000 in 2017. (See Figure 56.)
On average, college respondents earn back 46.3% of their operating costs via revenues. Some 38.8% of college respondents said they earn back 30% or less of their costs via revenues, compared with 26.4% of non-college respondents earning back 30% or less. At the other end of the spectrum, 30.2% of college respondents earn back more than 70% of their operating costs via revenues, compared with 33.3% of non-college respondents.
Not surprisingly, the No. 1 source of revenue for college and university respondents’ facilities comes from tuition and fees. More than three-quarters (78.6%) of college respondents said tuition and fees were a source of funding for their facilities, compared with just 31.7% of non-college respondents. The next most common sources of funding for college respondents were: facility rentals and private events (51.3%), membership and admission fees (51.3%), and private donations from individuals (31.6%).
College respondents were slightly more likely than others to report that they had taken action over the past several years to reduce their operating expenses. In 2025, 80.2% of college respondents had taken such action, down from 86.8% in 2024. This compares with 78.9% of non-college respondents in 2025 who had taken action to reduce their expenses.
Unlike other respondents, the most common way colleges chose to reduce their costs was by reducing staff. Some 44% of college respondents in 2025 said they had reduced staff in order to reduce operating costs, compared with just 24.1% of non-college respondents. The next most common methods used by college respondents to reduce their costs were: increasing fees (33.9%), cutting programs or services (31.9%), reducing their hours of operation (30.2%), and improving energy efficiency (25%).
College Facility Use & Construction Plans
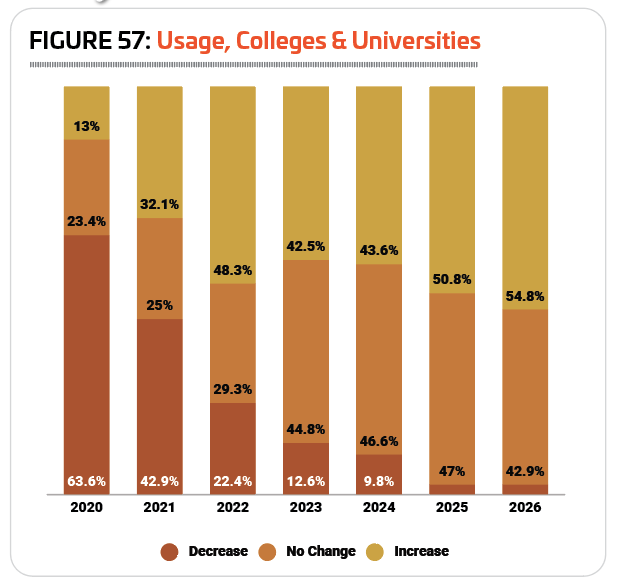
For the most part, college respondents reported that the number of people using their facilities either remained the same or increased from 2023 to 2024. Some 43.6% of college respondents saw
usage of their facilities rise in 2024, while 46.6% reported no change. Just 9.8% reported a decrease. (See Figure 57.)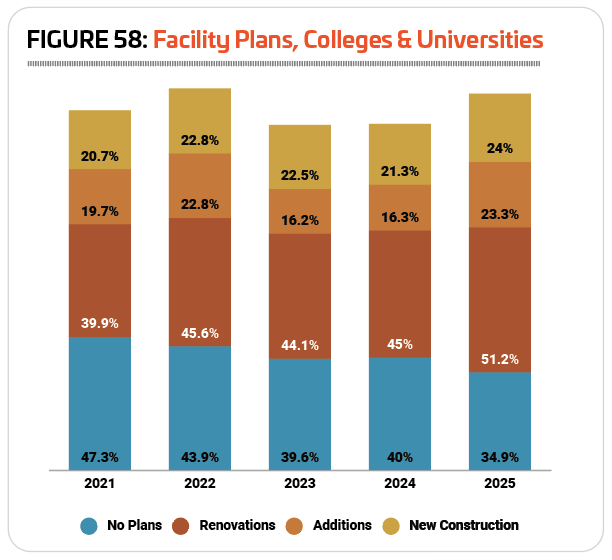
In 2025, more than half (50.8%) of college respondents said that they expect to see increasing numbers of people using their facilities, while 47% are anticipating no change, and 2.3% expect a decrease. And in 2026, even more—54.8%—expect the number of people using their facilities to rise, with 42.9% expecting no change, and 2.4% anticipating a decrease.
Respondents from colleges and universities in 2025 were more likely than in any year since 2020 to be planning construction, with nearly two-thirds (65.1%) indicating they had construction of some kind planned for the next few years. This is up from 60% in 2024 and 60.4% in 2023. That said, college respondents were among those respondents who were less likely to be planning construction. Nearly three-quarters (72.5%) of non-college respondents had construction plans.
The number of college respondents planning every type of construction increased in 2025. More than half (51.2%) were planning renovations to their existing facilities, up from 45% in 2024. Another 23.3% were planning additions to their existing facilities, up from 16.3% in 2024, and nearly a quarter (24%) were planning to build new facilities, up from 21.3% in 2024. (See Figure 58.)
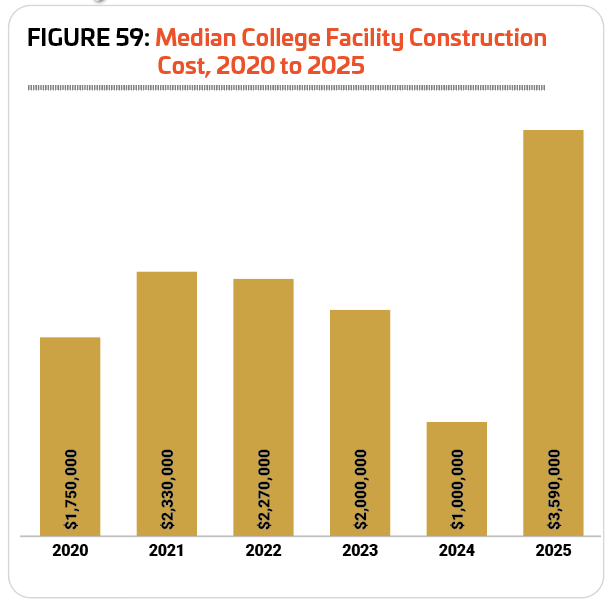 The average budget for college spending on construction in 2025 was around $34.1 million. The median construction cost for colleges was $3,590,000, a substantial increase of nearly 260% from 2024 when the median cost for construction was $1 million. (See Figure 59.)
The 10 features most commonly found among college respondents’ facilities in 2025 include: indoor sports courts for sports like basketball and volleyball, locker rooms, fitness centers, classrooms and meeting rooms, exercise studio rooms, bleachers and seating, natural turf sports fields, outdoor courts for sports like basketball and tennis, synthetic turf sports fields, and indoor walking and running tracks.
While they were more likely to be planning construction, college respondents were less likely in 2025 than in 2024 to be planning to add features and amenities at their facilities over the next few years. Some 26.3% of college respondents said they had such plans, down from 33.1% in 2024. This compares with 33.5% of non-college respondents in 2025 who had plans to add features to their facilities.
The most commonly planned additions for college respondents in 2025 include:
1. Synthetic turf sports fields (22.4% of college respondents with plans to add features were planning synthetic turf fields)
2. Outdoor sports courts for sports like basketball or pickleball (16.3%)
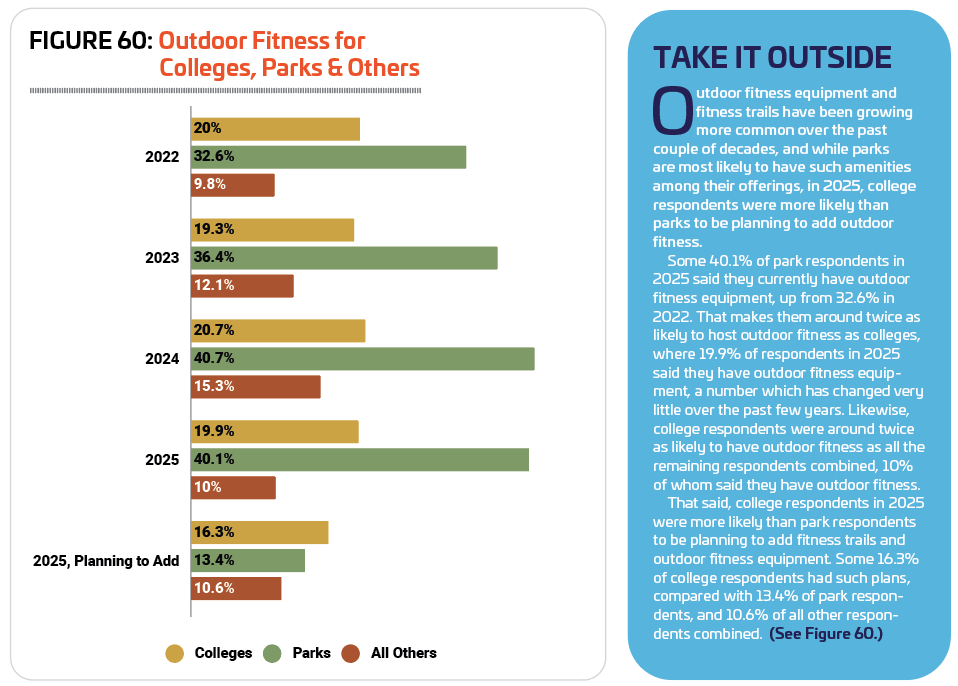
3. Fitness trails and outdoor fitness equipment (16.3%)
4. Bleachers and seating (16.3%)
5. Park shelters (12.2%)
6. Locker rooms (12.2%)
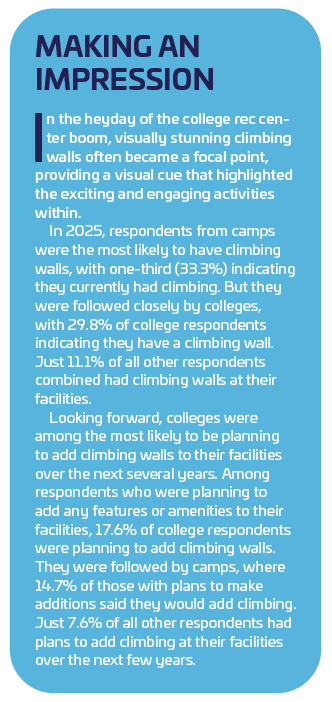
7. Climbing walls (12.2%)
8. Classrooms and meeting rooms (10.2%)
9. Concession areas (10.2%)
10. Fitness center (10.2%)
College & University Programming
The vast majority—96.8%—of college respondents said they provide programming at their facilities in 2025, up from 93% in 2024.
The most common type of programming in college respondents’ facilities continues to be fitness programs, though fewer college respondents in 2025 said they currently provide fitness programs—72%, vs. 81.3% in 2024. College respondents were much more likely than non-college respondents to offer fitness programming in 2025, with just over half (53.4%) of non-college respondents indicating that they host fitness programs at their facilities.
The next most common programs at college and university facilities in 2025 include: group exercise programs (69.6% of colleges host group exercise, down from 76.3% in 2024); mind-body balance programs such as yoga or Pilates (57.6%, down from 71.3%); adult sports teams (51.2%, down from 60%); individual sports activities such as running clubs (51.2%, up from 46.3%); functional fitness programs (50.4%, down from 62.5%); swimming programs (49.6%, up from 45%); personal training (46.4%, down from 56.3%); educational programs (45.6%, down from 48.8%); and sports tournaments and races (43.2%, down from 50%).
Less than one-fifth (17.2%) of college respondents in 2025 said they had plans to add more programs at their facilities over the next few years, compared with 25.8% of non-college respondents. This is down from 2024, when 32.6% of college respondents had plans to add programs at their facilities.
The most commonly planned program additions for college and university respondents in 2025 include:
1. Fitness programs (did not appear in the top planned programs in 2024)
2. Day camps and summer camps (did not appear in 2024)
3. Aquatic exercise programs (down from No. 2)
4. Group exercise programs (up from No. 5)
5. Functional fitness programs (down from No. 1)
6. Climbing programs (did not appear in 2024)
7. Nutrition and diet counseling (did not appear in 2024)
8. Personal training (did not appear in 2024)
9. Mind-body balance programs such as yoga and tai chi (did not appear in 2024)
10. Adaptive sports programs (did not appear in 2024)
Several program types that were in the top planned programs in 2024 did not appear in 2025 as top planned programs, including educational programs, holiday events and other special events, special needs programs, and swimming programs. RM
