


 Respondents to our annual Industry Report survey have been on an earnings upswing, which continued in 2025. What’s more, they’re happier than ever in their current positions. Higher earnings and greater satisfaction? Who could ask for more.
In our 18th Annual Salary Survey, we’ll take a look at the career-related results from the Industry Report survey, from salary and raises to job satisfaction, experience and more.
Who Are You?
Editor’s Note: For more details on respondents to the Industry Report survey, including the types of organizations and facilities they represent and the regions and communities they call home, read our Annual State of the Industry Report, featured in the June 2025 issue, and found online at recmanagement.com/industry-research.
We know that readers of Recreation Management often hold decision-making positi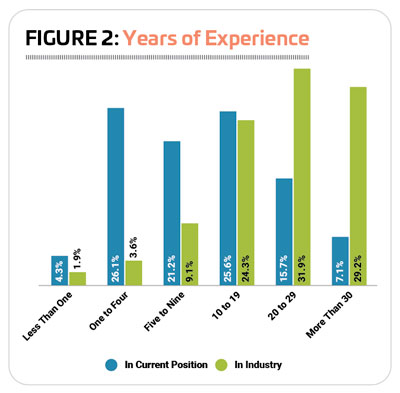 ons—the president of a health club, a school district superintendent, or a director role for a park district, YMCA, or campus recreation at a university or college. Because of this, respondents to the Industry Report survey tend to skew older rather than younger. Some 42.1% of respondents were at least 55 years old, and another 31.2% said they were between 45 and 54 years old. Another 18.5% were between 35 and 44 years old, and just 8.2% were younger than 35 years old.
Respondents to the survey did not reflect the diversity of the U.S. population at large, with nearly nine out of 10 (89.6%) respondents indicating they were white, up slightly from 2024, when 88.8% were white. (For reference, non-Hispanic Whites make up the largest racial and ethnic group in the U.S., and made up 59.3% of the population in 2022.) Another 5% of respondents were black (unchanged from 2024), 5% were Hispanic (down from 5.4%), 1.1% were Asian/Pacific Islanders (virtually unchanged from 1%), 0.6% were Native American or Alaskan Natives (down just slightly from 0.9%), and 1.6% identified themselves as representing “other” ethnic or racial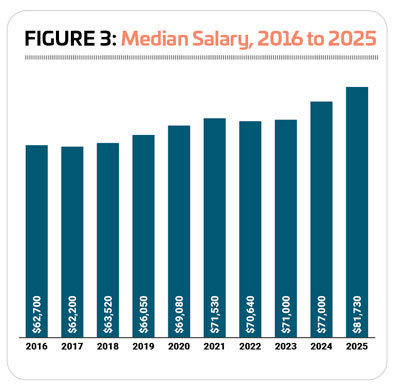 backgrounds.
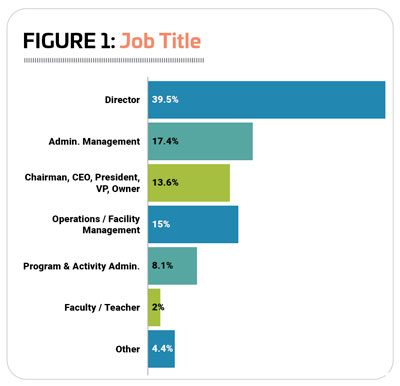
While respondents to the survey have many different roles in their organizations, a majority hold higher-level, decision-making positions in their organizations. The largest number of respondents—39.5%—said they are directors. Another 17.4% are in administration and management positions, including administrators, managers, and superintendents. Some 15% hold operations and facility management positions, including operations managers, facility managers, building managers, and supervisors. Some 13.6% of respondents said they are the chairman, CEO, president, vice president, or owner of their organization or company. Another 8.1% of respondents have program and activity administration roles, including activity and program directors, managers, coordinators, specialists, coaches, and instructors. A handful of respondents—just 2%—said they are faculty or teachers, and 0.4% are in planning roles like architect, designer, or consultant. (See Figure 1.)
From Educated to Experienced
Industry Report survey respondents are well-educated, with the majority—81.3%—indicating that they have earned at least a bachelor’s degree. Some 44.6% said they had a bachelor’s degree, while 33.4% had earned their master’s degree, and 3.3% had earned an advanced degree, such as a Ph.D. Another 6.4% of respondents had earned a two-year, or associate’s, degree, and 8.7% had attended college without earning a degree. Finally, 3.7% said their highest level of educational achieve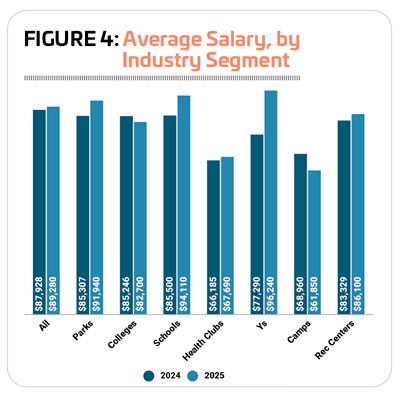 ment was a high school diploma.
On average, respondents have been in their current position for 12.6 years, up from 11.7 in 2024.
On top of that education, respondents have a great deal of experience, not just in the industry but also in their current roles. More than one-fifth (22.8%) have been in their current positions for at least 20 years, and around another quarter (25.6%) have held their positions for 10 to 19 years. Some 21.2% have held their current role for five to nine years, and 26.1% for one to four years. Just 4.3% of respondents have been in their current jobs for less than a year.
Industry Report survey respondents also have plenty of industry experience to rely on, with an average of 23.1 years working in the recreation, sports, fitness, and aquatic fields. Nearly three in 10 respondents (29.2%) have at least 30 years of industry experience, and more than three in 10 (31.9%) have between 20 and 29 years of experience. Another 24.3% of respondents have 10 to 19 years of experience. Just 9.1% have five to nine years, and 5.5% have less than five years of experience working in the industry. (See Figure 2.)
Money Talks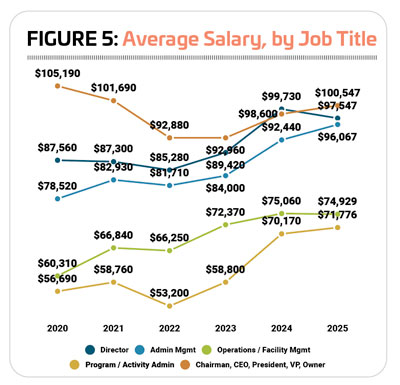
In 2025, the average respondents reported an annual salary of $89,280, up 1.5% from $87,928 in 2024. The median salary for respondents in 2025 was $81,730, 6.1% higher than the median in 2024, of $77,000. (See Figure 3.)
Reporting both the highest average salary in 2025 as well as the greatest increase to average salary from 2024 to 2025 were respondents from Ys, with an average salary of $96,240, up 24.5% from the average reported in 2024 of $77,290. School respondents also reported a double-digit increase, with the average salary increasing 10.1%, from $85,500 in 2024 to $94,110 in 2025. The next greatest increase to average salaries was reported by park respondents, who saw their average salary increase 7.8%, from $85,307 in 2024 to $91,940 in 2025. (See Figure 4.)
Smaller increases were reported by respondents from rec centers (up 3.3%, from $83,329 to $86,100 in 2025), and health clubs (up 2.3%, from $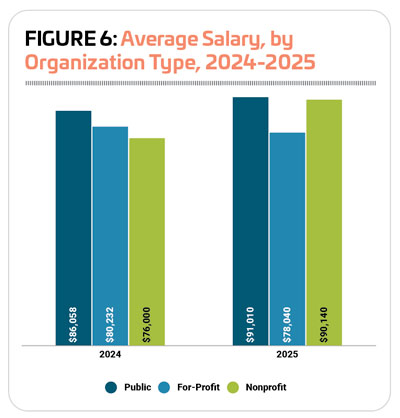 66,185 to $67,690 in 2025).
Respondents from colleges and camps saw their average salary fall in 2025. Respondents from colleges saw a 3% decline, from an average of $85,246 in 2024 to $82,700 in 2025. And respondents from camps saw a decrease of 10.3%, from an average salary of $68,960 in 2024 to $61,850 in 2025.
Considered in terms of job roles, the highest-paid respondents held the title of chairman, CEO, president, vice president, or owner. These respondents earned an average salary of $100,547 in 2025, up 2% from $98,600 in 2024. The job title that saw the biggest salary increase from 2024 to 2025 held administration and management positions. These respondents had an average salary of $96,067 in 2025, up 3.9% from the average of $92,440 for 2024. Respondents in program and activity administration roles also saw an increase to their average salary, reporting a 2.3% increase from an average of $70,170 in 2024 to $71,776 in 2025. (See Figure 5.)
Respondents who hold operations and facility management positions saw virtually no change to their average salary from 2024 to 2025, reporting a 0.2% decrease from $75,060 to $74,959. Finally, respondents who hold the title of director at their organizations repo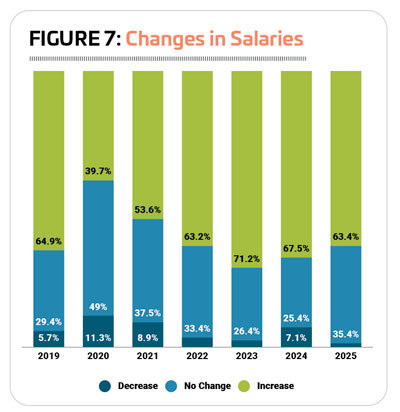 rted a 2.2% decrease to their average salary, from $99,740 in 2024 to $97,547 in 2025.
Considered by organization type, respondents working for public or governmental organizations had the highest average salary in 2025—$91,010, which represents a 5.8% increase over 2024, when the average salary for respondents from public organizations was $86,058. Respondents working for private nonprofit organizations followed close behind in 2025, with an average salary of $90,140, 18.6% higher than their average for 2024 of $76,000. On the other hand, respondents working for private, for-profit organizations reported a 2.7% decrease to their average salaries, falling from $80,232 in 2024 to $78,040 in 2025. (See Figure 6.)
While the number of respondents reporting a salary increase for 2024 was slightly lower than for 2023, still more than two-thirds (67.5%) of respondents said they saw a salary increase in 2024. Those who reported a salary increase saw an average raise of 3.7%. Another 25.4% of respondents said their salary remained unchanged in 2024, while 7.1% reported a decrease. (See Figure 7.)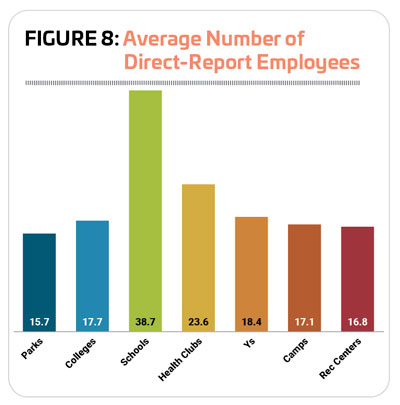
Looking forward, some 63.4% of respondents said they expect their salaries to increase in 2025. These respondents are expecting an average increase of 3.3%. More than one-third (35.4%) of respondents are expecting no change to their salary this year, and just 1.2% are anticipating a decrease.
Satisfaction (Practically) Guaranteed
On average, respondents in 2025 said they have 20.7 employees reporting directly to them, virtually unchanged from 2024, when respondents had an average of 21 direct reports. The median, however, was 8.8.
As usual, respondents from schools had the greatest number of direct-report employees, with an average of 38.7, up slightly from 36.8 in 2024. They were followed by respondents from health clubs, with an average of 23.6 direct-report employees. All other facility types had similar numbers of direct-report employees, with Ys averaging 18.4, colleges averaging 17.7, camps averaging 17.1, rec centers averaging 16.8, and parks reporting the smallest number of direct-report employees, at 15.7. (See Figure 8.)
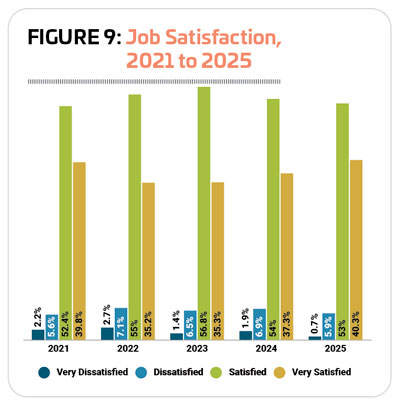 When it comes to how satisfied they are in their current roles, respondents to the Industry Report survey in 2025 were happier than ever. Some 93.3% of respondents said they’re satisfied in their current positions, indicating that they are either satisfied (53%, down slightly from 54% in 2024) or very satisfied (40.3%, up from 37.3%). Just 5.9% of respondents are dissatisfied in their current roles, and less than one in 100 (0.7%) said they were very dissatisfied. (See Figure 9.)
Who’s happiest in their work? Respondents working for camp facilities! In fact, 100% of camp respondents said they’re satisfied in their current roles, with more than half (52%) indicating they are very satisfied with their work. They were followed by health clubs, where 95% of respondents reported being satisfied with their current roles. More than nine in 10 respondents from rec centers (93.9%), parks (93.8%), Ys (92.2%), and schools (91.9%) also said they are satisfied with their current roles and responsibilities. College respondents came out last, though 88% reported being happy in their current jobs. RM
